myRIO
This handbook will get you up to speed on the basics of the National Instruments myRIO, including initial setup, hardware, software, and configuration.
Setting up your myRIO
myRIO Hardware

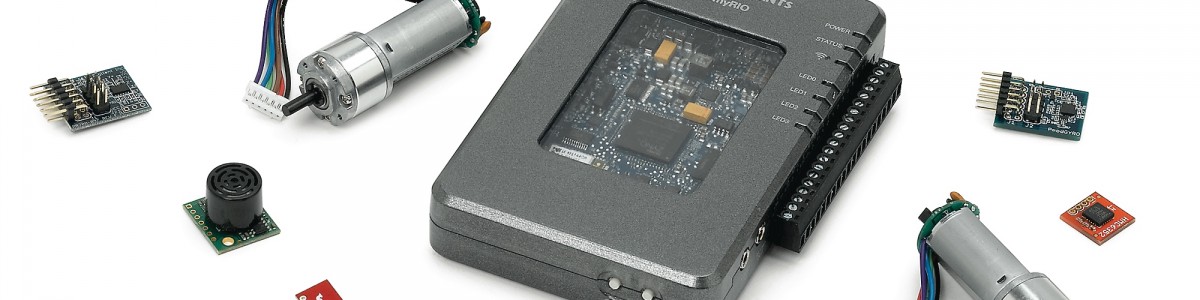
This image shows the hardware attachment points on the myRIO.
The kit should include the following:
- NI myRIO
- myRIO power cord
- myRIO USB cord
- Various power adapters (for international use)
- Mini System Port (MSP) Screw-Terminal Connector
- myRIO Expansion Port (MXP) wirewrap breakout
On the myRIO there is:
- WiFi on/off switch
- Button
- 4 programable LEDS
- 3 status LEDs (power, status, and WiFi)
- Audio in/out connectors
- Mini System Port (MSP)
- myRIO Expansion Port (MXP)
myRIO Software
First you need to create an account here (you must your your university account to get a student license).
To work with myRIO you will need the latest myRIO Software Bundle
The myRIO Toolkit is compatible with 32-bit WINDOWS LabVIEW only. Therefore, you must have 32-bit Windows LabVIEW installed even if you use a 64-bit operating system.
The myRIO Software Bundle includes:
- LabVIEW
- LabVIEW RIO (Reconfigurable I/O)
- LabVIEW RT (Real Time)
- LabVIEW FPGA (Field Programmable Gate Array)
- NI RIO Drivers
- Various other optional LabVIEW and RIO drivers depending on intended use
If your computer does not have a built in .iso reader (a virtual CD drive) you can find one online. I used Virtual Clonedrive and it worked fine.
National Instruments will ask you to activate your license. The evaluation copy will work for about 30 days, but student licenses are rather inexpensive and last for six months from the purchase date.
There will mostly likely be a lot of updates and patches for the software. If you run into updating issues, some updates are dependent on others and need to be installed separately.
Plugging in the myRIO for the first time

The USB monitor will appear every time a myRIO is plugged in.
The first time you plug in the myRIO via USB a USB Monitor Window will appear. Launch the getting started wizard. The wizard will update and install the newest software onto your myRIO. (The myRIO runs its own Linux based LabVIEW and other software.) When it restarts the device and the menu reappears click "do nothing" a few times. Eventually you will be able to test the on-board LEDs button and accelerometer.

Use this window to test the myRIO's onboard devices. There is an accelerometer, button, and 4 LEDs.
Configuring myRIO
Every time you plug in the myRIO the USB Monitor will appear. If you click on the "Configure NI myRIO" tab you will be brought to a locally hosted site. (You may need to install Microsoft Silverlight and restart your web browser). Here you can see and adjust a lot of the settings for your myRIO.
For now, all you need to know is the name and current IP address (most likely your USB port's IP address) for your myRIO. For more details on configuring the myRIO see below.
The settings include:
- System Configuration (Change the name of the myRIO, adjust the startup settings, and see what is connected to the myRIO)
- File Browser (Load/unload files from the myRIO)
- Security (Edit permissions on you myRIO)
- Network Settings (View the MAC address and connect the myRIO to a wireless network. Once connected to a wireless network the myRIO will be given an IP address. This may change periodically and can also be viewed in the system configurations page. The myRIO can even create its own local network. More information can be found in this video.
- Software Management (See what software is currently installed and running on myRIO)
- Date and Time Adjustment
- Web Services (manage the myRIO's publishing to and reading from the web)
- Web Servers (control HTTP and SSL connections)
- Installed Configuration Tools (Adjust the configuration page)
Project 1: LED Level
The following guide will help you create an LED level using an accelerometer. The myRIO has an onboard accelerometer, 4 built in LEDs, and a button which will be used in this guide to create a level along the Y-axis. The LEDs should indicate how far from level the device is and in which direction a user should rotate it to make it level. (Assume the X and Z axis are stable). How can you best use the 4 onboard LEDs to accomplish this?
If you have never used LabVIEW please refer to the Introduction to LabVIEW section.
Your first VI from scratch and targeting your myRIO
-
In LabVIEW create a new blank project.
-
Right click on Project (the top line) -> New -> Targets and Devices -> New Target or device -> myRIO-1900. Then choose your myRIO.
-
Right click on myRIO in the project -> properties -> add IP address (enter the current connection IP address (USB or WiFi IP address))
- Last, create a new VI on the real time processor (this will use the default FPGA identity). Right click on RT Target -> New -> VI
In the bottom left corner of the VI it should say the project name and your myRIO. If it does not, right click the bottom left and select your myRIO.
A video of this process (done with compact RIO) can be found in the sidebar.
Live Accelerometer Data
To determine whether the myRIO is level we will use the built in accelerometer. It has predetermined X, Y, and Z axis. For more information on the accelerometer refer here. However, for the scope of this project we can use an express VI from the standard myRIO toolkit.
To graph in real time with LabVIEW use a waveform chart.
(HINT to display multiple plots on one set of axis use a cluster. Each element inside the cluster will graph as its own line.)
Activity: Live Accelerometer Data

This is a plot of the accelerometer data from the myRIO.
Use the myRIO accelerometer express VI and a loop to plot live data (every 10 ms) for all 3 axis on a graph. Use a stop button as a control to exit the loop and end the program.
To continually take in accelerometer data we need to repeat the same code over and over again. For this repetition use a while loop.
If you are struggling download partial-solution.vi and it will walk you though the gathering data process.
Solution

Here you can see the accelerometer data flowing into the waveform chart. Also the loop will exit when the stop button is pressed.

This solution to graphing the data uses express VIs.

This solution uses myRIO channels. This is slightly more complicated and hidden behind every express VI.
The while loop will run until the stop button is pressed. The loop will wait 10ms between each cycle. During each cycle the accelerometer will read a value for each axis and then graph all three on one plot.
Controlling Onboard LEDs
The myRIO has 4 built in LEDs and a button. For this project the express VIs will be sufficient but more LED information is located here and more information on buttons is located here.
Activity: Controlling Onboard LEDs

If the button is pressed the green LED will light up.
Use the myRIO LED and button express VIs to turn on LED0 when the button is pressed. Also include a virtual LED indicator on the front panel.
More information on indicators below.
Solution
The output of the button is a boolean and so is the input of the LED control. The pacing of the loop will determine how fast the response time is.

Here you can see the boolean values flowing through the VI. Notice how highlight execution slows down the program. The loop will exit when the stop button reads true.

This solution uses express VIs. It is simple and straightforward.

This solution uses myRIO channels. This is slightly more complicated and hidden behind every express VI.
Is the myRIO Level?
When the myRIO is stationary on a flat surface the values for each axis remain constant.
Activity: All Level?
Use the accelerometer values to light up an onboard LED and a virtual LED indicator when the myRIO is level and stationary. The is-level-components.vi has all the needed blocks to complete this activity. However, the VI is not assembled. Drag the blocks into their correct locations and wire them up to create a runnable VI.

The graph will plot live data. If the x, y, and z axis are all "level" then the virtual LED will light up.
(HINT case structures cannot take double precision floating point numbers (orange wires in LabVIEW), it will convert them to integers so multiply the values by a constant before defining cases. Also, don't forget about the default case!)
The partial-solution.vi is a partially assembled solution to this activity.
Solution
Each of the axis' data is fed into a case structure to determine if that axis is level. If all are level, the LED will turn on. The axis' data is multiplied by a scalar constant because case structures will not take decimals. The default cases are when the myRIO is level.

This shows LabVIEW deciding between case structures.

This solution uses express VIs and case structures.

This solution uses myRIO channels. The channels are hidden behind express VIs but the overall structure of the solution is the same as solution 1.
Progressive Level
Now we should be able to put all of this together to accomplish the original goal.
Activity: Progressive Level
Use the 4 built in LEDs and the accelerometer to create a level along the Y-axis. The LEDs should indicate how far from level the device is and in which direction a user should rotate it to make it level. (Assume the X and Z axis are stable). How can you best use the 4 onboard LEDs to accomplish this?

The graph will plot live data. It will also mimic the LEDs on the myRIO to show how level the device is.
Solution
These are two solutions to this activity. The first evaluates the axis data and enters the respective case structure. Each case has a specific LED configuration.
progressive-level1.vi
progressive-level2.vi
This shows LabVIEW deciding between case structures.

This shows the different cases in the case structure. As the myRio is less level, more LEDs turn on. This method is rather inefficient as it requires an express VI in each case.

This shows the different cases in the case structure. As the myRio is less level, more LEDs turn on. This solution uses math to simplify the LED selection.
The second method has a case for positive and a case for negative. It then does division to determine which lights should turn on.
Going further
Visit Dr. E's Challenges to upload your own level solutions, and see how others approached this project.
Here are some other cool project ideas that use the same basic principles as the level you've completed.
- What happens when you bump the myRIO on a table? How can you display that?
- Can you use the button to "zero" the level (turn whatever the current position is to "level")?
- What angle is the myRIO at?
Project 2: Binary Counter
This project details how to build a binary counter. When counting in binary there are only two values: TRUE (1) and FALSE (0). Using a combination of these values and some clever logic we can create any number. We will create a series of places, each holding its own value (bit). The first will represent 2^0 (convenient because computer science almost always starts counting at 0), the second will be 2^1, then 2^2, etc. This will give us the series 1 2 4 8 etc. This means that we could count up to 15 with a 4 bit system if we add up all of the represented values.
Using this method we can create counters and clocks.
Make a countdown timer
In previous projects, you have used a wait to pace your loop. This means that the code within the loop will run and then it will wait before looping again. That means if you include a 10ms wait, the loop is actually running slightly slower. When we need precise timing in LabVIEW we use a single cycle timed loop. This type of loop can be configured to run at a precise rate. If you set the dt of the timed loop to 10ms, the loop will run exactly every 10ms.
Activity: Make a countdown timer
Use a single cycle timed loop to create a countdown clock. Display the remaining time with a dial. Include a user input for the time and the onboard button as a start button. When the timer reaches 0 seconds, have an LED on the myRIO and the front panel turn on.
In order to remember a value from the last loop iteration, LabVIEW uses shift registers. This will allow you to keep track of values from the last loop iteration so you can keep track of the current time remaining.
If you need help, the partial-solution.vi file is missing some parts of the complete solution. It contains all the needed structures, controls, and indicators; but none of the operations and logic.

This is the user interface for the count down timer. A dial displays the time remaining and and LED displays if time has run out.
Solution
The user control can be trigger via either a switch statement or a case structure. The gauge is simply an indicator and the loop subtracts one from the remaining time with every cycle. When the remaining time is 0 an LED turns on and the program exits the loop.
countdown-timer1.vi
countdown-timer2.vi

This solution uses a switch statement instead of a case structure to determine whether or not to enter the countdown loop. The button will only affect the program if it is not counting down.

This solution uses a case structure instead of a switch statement to determine whether or not to enter the countdown loop. The false case contains a false constant to wire to the stop condition.
Make a binary counter
In the last example we counted down. In this activity we will count up using the binary addition method.
Activity: Make a binary counter
Count up from 0 and display the current count (in seconds) with virtual and onboard LEDs. Use the binary counting system to represent the current time. (1 2 4 8). The lights should change at precisely 1 second. Include a virtual and onboard reset button to restart the counting at 0 and a stop button to peacefully end your program (your program should always have one of these).

These LEDs mimic the the myRIO's LEDs. They're labeled with their values to make reading the counter easier. The maximum value if 15 with 4 LEDs.

Use this if you need help creating the binary counter.

There are two easier ways to approach this problem and many other more complicated solutions.
- The modulus operation (Quotient & Remainder operator in LabVIEW).
- Integer division (this can be created using the regular divide function and a round to -infinity function).
- Other more complicated solutions include but are not limited to bit-shifting and boolean operations.
Solution
Every second, the count increases. It checks if it is divisible by 8, if it is it subtracts 8; and so on with 4, 2, and 1. This is possible to do with either integer division or a modulus operator.
The reseting can either be done with a loop (exit the count-up loop and restart) or a switch statement (the current time switches to 0)
binary-counter-countup-clock1.vi
binary-counter-countup-clock2.vi

The quotient and remainder tool works like a modulus function. A series of cases structures determine which LEDs to light up.

There is no integer division function in LabVIEW. You can create integer division by dividing and rounding down [toward -infinity]. A series of cases structures determine which LEDs to light up.
Going Further
Visit Dr. E's Challenges to upload your own binary counter solutions, and see how others approached this project.
Here are some other cool project ideas that use the same basic principles as the binary counter.
- Make an LED Binary clock using a breakout board and LEDs.
- Display each counted number on a pixel display.
Project 3: Smart Night Light
In this project you will build a smart night light. The darker in the room it gets, the brighter the light will get.
This will be the first project using the myRIO expansion ports.
For this project you will need:
- Some type of expansion system (detailed below)
- An LED (you can choose the color and size)
- A resistor (Anything from 1ohm to 100kohm will suffice, I used a 10kohm resistor)
- A photoresistor
- Jumper wires
myRIO Expansion Options
There are 2 types of ports on the myRIO. The Mini System Port (MSP) is located on the right under the LEDs. The myRIO Expansion Ports (MXP) are located on the left side. The MXP port can be used with female header wires or certain expansion boards custom made for myRIO. The MSP port can take any wire (male jumper wires work very well) or other specialized breakout boards. Digilent makes a lot of specialized boards for myRIO.

[L to R] the Mini System Port and breadboard, the myRIO expansion port and wirewrap, and the digilent myProto accessory board.
In the picture (L to R), there is an MSP port and protoboard (breadboard), an MXP wirewrap (comes with myRIO), and a Digilent myProto accessory board. Any of these will work and you will find some of these options better for certain projects than others.
The MXP options are great for specialized tasks with custom boards or applications needing a lot of pins, you will mostly likely also need to pair it with a protoboard. The MSP myProto is great because it converts all the screw connections into "breadboard pins" and has kill switches for 5V and +/-15V. Any protoboard will also work with the MSP port, you just have screw in the wires yourself.
For convenience and ease of use I will use various Digilent boards throughout this tutorials.
Basic LED Controls

This depicts the flow of electricity in the circuit for this activity.
One of the most basic circuits you can make contains an LED. In order to not blow out the LED we can use a resistor to limit the amount of current the LED gets.
The myRIO can send and receive two types of signals, analog and digital. An analog input will read in the voltage. An analog output will output a periodic wave at a given maximum voltage and frequency. A digital output will be either 0 (FALSE) or 3V (TRUE). A digital read works similarly; if the input is greater than 3V the input will read true, otherwise it will read false. You can find the digital and analog read/write commands in the myRIO section of the toolkit on the block diagram. Be careful about which pins you select to read and write to.
Activity: LED on with 5V

This will light up via a constant 5V signal.
The LED needs some type of power to turn on and light up. Connect the long end of the LED (anode) to +5V. Then connect the cathode of the LED (the short end) to the resistor and that resistor to ground (GND). It should light up. This 5V port will always output 5V whenever the myRIO is on.
Activity: LED on with Digital Signal

This is the schematic for the wiring of the digital solution.
Write a VI that turns on the external LED when the onboard button is pressed. Output TRUE to a digital pin when the button is pressed and false otherwise. Wire your LED-resistor circuit to that pin and ground. Notice how the LED is not as bright when powered with a digital signal? (remember it is only 3V)
Solution
The button outputs a boolean and the digital write takes a boolean so they can be simply wired together.

This will light up via an digital signal, but remember it is either true [3V] or false [0V].
Activity: LED on with Analog Signal

This is the schematic for the wiring of the analog solution.
Write a VI that turns on the external LED when the onboard button is pressed. Send 5V to an analog pin when the button is pressed and 0V when not pressed.
Now use a front panel control to change the voltage. Notice how the LED turns off before the voltage decreases to 0? This is called a forward bias. Also, keep in mind that the signal is actually a wave. The LED is only actually on when the value of the wave is above that bias number, which is why it is still dimmer. This can cause problems in more complicated circuits, but we will discuss that soon.
Solution
The button outputs a boolean value but the analog write takes a double precision number. To convert this, use a switch statement. When true...When false...

This will light up via an analog signal, but remember it is a wave.
Dimming LEDs on the Real Time Processor
As you have seen from the basic LEDs section, you can change the brightness of an LED by changing the current through it. With this method the only way to adjust the brightness would be to change the resistor in the circuit, or use a potentiometer (variable resistor).
If you want to control the brightness precisely using the myRIO or a computer you will have to use a technique called pulse width modulation (PWM). PWM is essentially a digital output. By oscillating between true and false the output looks like a "square wave". By changing the percent of time high and low you can create different brightnesses. This is called the duty cycle, and it generally will vary as a decimal between 0 and 1 or as a percentage between 0 and 100. The higher the duty cycle the longer the light is on in each given HIGH-LOW cycle. Be sure you use a high enough frequency so you don't end up with a strobe light!
Activity: Real Time Dimming

This is a basic schematic to see the effect of PWM on DIO3 on an LED.

This shows the flow of electricity.
Located in the myRIO toolkit, use the PWM expressVI to create a VI where you can control the brightness of an LED.
Solution
There is a convenient ExpressVI for PWM. Simply specify the pin and control the frequency and duty cycle.
real-time-dimming-pwmrt1.vi
real-time-dimming-pwmrt2.vi

This uses an express VI and the default FPGA to create a PWM signal on DIO3.

This is the basics of a PWM signal. it is all located on the real time processor and the default FPGA personality.
Dimming LEDs on the FPGA
Now you will create your own PWM signal on the FPGA. The major benefit to the FPGA is that it runs extremely fast. If you are not currently working in a myRIO FPGA project right click on the myRIO and select new Targets ad Devices. Select the myRIO chassis and because the FPGA is integrated it will be inputed into the project. Now right click on the FPGA target and create a new VI. The FPGA also has I/O but it works a little different.
(NOTE: If using a standard non-student/non-educational license you get 1 year of free cloud compile.)
(NOTE: If local compile is not working or it says "cannot find host" then you need to download Vivado Tools.)
Activity: FPGA Dimming

This is a basic schematic to see the effect of PWM on DIO3 on an LED.

This shows the flow of electricity.
Use a digital I/O write to control an LED with PWM. A control should allow you to change the brightness. A flat sequence will help execute things in order. It will not proceed to the next element until the previous is complete. This way you can wait between digital writes. The pictured examples wait for a value in use.
This activity can be done using two controls (a high count and low count) or one control and a local variable. If you chose the second method you may also need to establish a total count or a maximum count. A PWM signal can also be generated using a loop counter and threshold.
Solution
The flat sequence method is more straightforward. Make the pin true, wait, make it false and then wait again. Each time can be decided independently or one can be a function of the other.
The counter method uses a threshold. The counter will increase linearly until the max value, then drop to 0. If we set a threshold somewhere along that linear path we can control how long it is true vs false. Be careful with you comparison logic if using this method.
fpga-dimming-pwmfpga1.vi
fpga-dimming-pwmfpga2.vi

This uses a flat sequence and wait commands to create a pwm signal on DIO3.

This uses a counter. If counts from 0 to the maximum specified value. If the "count on" is less than the "current count" the LED will be off until the "current count" passes the "count on".
Measuring Ambient Light

This has a variable distance related to the brightness on the sensor.
In order to make a nightlight, the myRIO has to know when to illuminate the light. This can be done with a photoresistor. The brighter it is in the room, the less resistance it will have. If hooked up in series with an LED you will notice the LED gets darker as the room gets darker (cover the photoresistor to simulate turning off the lights. But how do we measure how dark it is in the room? When placed in series, the photoresistor and the LED form a voltage divider circuit and we can measure the voltage in the middle.
Activity: Measuring Ambient Light
Make a simple VI to graph the input voltage in between the photoresistor and the LED.
NOTE: If using the MSP port you have an AI0+ and an AI0-. You will measure in one (for measuring positive or negative signals) and you must ground the other. If you are using the MXP port there are only AI0-AI3 so this is not an issue.

This is a graph of the voltage controlled by the photoresistor.

This schematic uses a voltage divider a measures the voltage between the photoresistor and the LED.

This schematic shows the circuit used to measure ambient light. The LED should dim as it gets darker.
Solution
The VI here is very straightforward, just analog read into a graph.
measuring-light-photoresistor.vi

This is a simple VI for graphing the analog input in between the photoresistor and the LED.
The Smart Nightlight
The analog input signal is a somewhat arbitrary value, so if it is easier you can multiply the analog signal by 1.221 to convert it into volts. Below you will make the night light on the real time processor and the FPGA.

This schematic uses a voltage divider a measures the voltage between the photoresistor and a constant resistor. It has an LED connected to DIO3 which will output a PWM signal.

This schematic uses a voltage divider a measures the voltage between the photoresistor and a constant resistor. It has an LED connected to DIO3 which will output a PWM signal.
Activity: Making The Smart Nightlight - Real Time Processor

How can you invert the analog input into a PWM duty cycle?

This is the graph of PWM signal vs analog input. Notice the inverse relationship.
In order to make a smart nightlight we need to inversely control the PWM signal by the amount of light. That is the darker the room, the brighter the light and vice versa. How can you convert the input into a duty cycle for the PWM signal?
Make a graph of the raw data vs. the PWM signal so that the inverse relationship is visible. Make a control for the PWM frequency. Notice how the light starts to flash if the frequency drops too low?
Solution
Once the basic architecture for the night light is complete, the math should not be too difficult or complex. Using the maximum and minimum values from the analog input convert accordingly to a value between 0 and 1. A linear function works well for this.
night-light-realtime-main_rt.vi

This is the completed block diagram for the night light.
Activity: Making The Smart Nightlight - FPGA

How can you use the PWM from the previous activity to create the nightlight?
The FPGA is extremely fast and can run while the real time processor is doing other applications. This allows for parallel processing. It is hard to analyze data on the FPGA but it is great for data acquisition.
FPGAs can only carry certain data types like integers, fixed-point, and single precision numbers.
Use the same circuit as the real time night light but transfer all the processing to the FPGA. This will require the use of FPGA I/O nodes and one of the two types of FPGA PWM signals you generated earlier. You should also make a real time VI that calls the FPGA program so you do not need to recompile as often.
Solution
Depending on which way you prefer to code a PWM signal on the FPGA there are at least two options here.
If you chose the sequence option you can filter the data to be within a certain range and then subtract that lower bound. This will give data between 0 and the upper bound minus the lower bound. This can then be used to generate a PWM.
If you are using the loop counter to generate the PWM filter the data the same way and then compare it to the current loop counter. Be careful with your logic.
night-light-fpga-main_fpga1.vi
night-light-fpga-main_fpga2.vi

This uses the flat sequence to create a PWM signal. The high and low values can be calibrated according to the light in the room. The input data is filtered to make sure it will not cause an error from being above or below the calibrated values.

This uses the counter method to create a PWM signal. The high and low values can be calibrated according to the light in the room. The data is filtered to make sure it will not cause a math error.
Going Further
Visit Dr. E's Challenges to upload your own smart night solutions, and see how others approached this project.
Here are some other cool project ideas that use the same basic principles as the smart nightlight.
- Analyzing data from different types resistor inputs (pressure, temperature, color, etc)
- Changing colors of an RGB LED as input values change.
Project 4: Digital Dice
In this project you will create digital dice using a basic LED pixel matrix. When shaken the myRIO will choose a random number, show a "thinking pattern", then display it like the face of a die on the LED display.
For this project we will need 9 digital outputs so you should use the MXP port. You can either use this schematic and female header wires or the MXP wirewrap that comes with the myRIO or various other expansion boards.
For this project you will need:
- An MXP expansion system
- 9 LEDs (you can choose the color and size)
- Jumper wires
In this project we will use SubVIs to simplify the block diagram.
Creating the Pixel Matrix
For the digital dice we will use 9 LEDs set up in a square. Remember that LEDs are forward biased and will only work in one direction.

Use this to create your own pixel matrix.
Activity: Wiring the pixel matrix
Wire all the the cathodes (short end) to the same ground on your board. Then connect this to ground. Each LED will connect to its own digital pin.

Use this to help wire the circuit if you are not using an MXP breakout board.

NOTE: Replace the red wires with LEDs. Use this to create your own pixel matrix.
How to Trigger the Dice
To be as realistic as possible, the die should change every time you throw it. However, we can't throw a myRIO and LEDs around, so what if we shake the device?
How can you tell when the device was shaken? Lets start with some basic accelerometer tests.
Activity: Triggering

A graph of the accelerometer [total, x, y, and z] when the device is shaken and bumped. How can you use this to trigger an event or exit a loop?
Plot the accelerometer data as well as the sum of each data stream. What happens when you shake or bump the myRIO? How is it different from slowly rotating the device?
Use this information to write a VI that lights up a virtual LED and stops the program if the device is shaken or bumped. Call this vi trigger.vi.
Solution
A threshold of a combined 2G's of shaking/bumping the myRIO will trigger an action. Whenever the combined accelerations are over that threshold the loop will end.
digital-dice-trigger-solution.vi

The background code for triggering the dice to generate a new number. I used a threshold of 2G's for the shaking/bumping.
Creating a Pattern with the LEDs
After you shake your myRIO to trigger a new dice number you should show a "thinking" display. This display can be a sequence of commands. For this you should use either a flat sequence or a stacked sequence. A LabVIEW sequence will dictate the order of execution when there is no dataflow. A flat sequence is great for small sequence, but you should use a stacked sequence for anything long because they take up less space.
Activity: Thinking patterns

This pattern will run while the myRIO is thinking. Be creative and come up with your own cool pattern.
Use a sequence to create a "thinking pattern" VI. It can last for as long or short as you would like, I made mine about one second. Be creative and have fun with it. You can also include loops. Make sure the VI is under the myRIO target in the project and call it thinking.vi.
Do not put the entire thing in a loop, unless the loop will automatically terminate after the pattern has been played (via a boolean or loop count etc).
Making the Dice

These are the 6 faces of a standard die that can be recreated with LEDs.
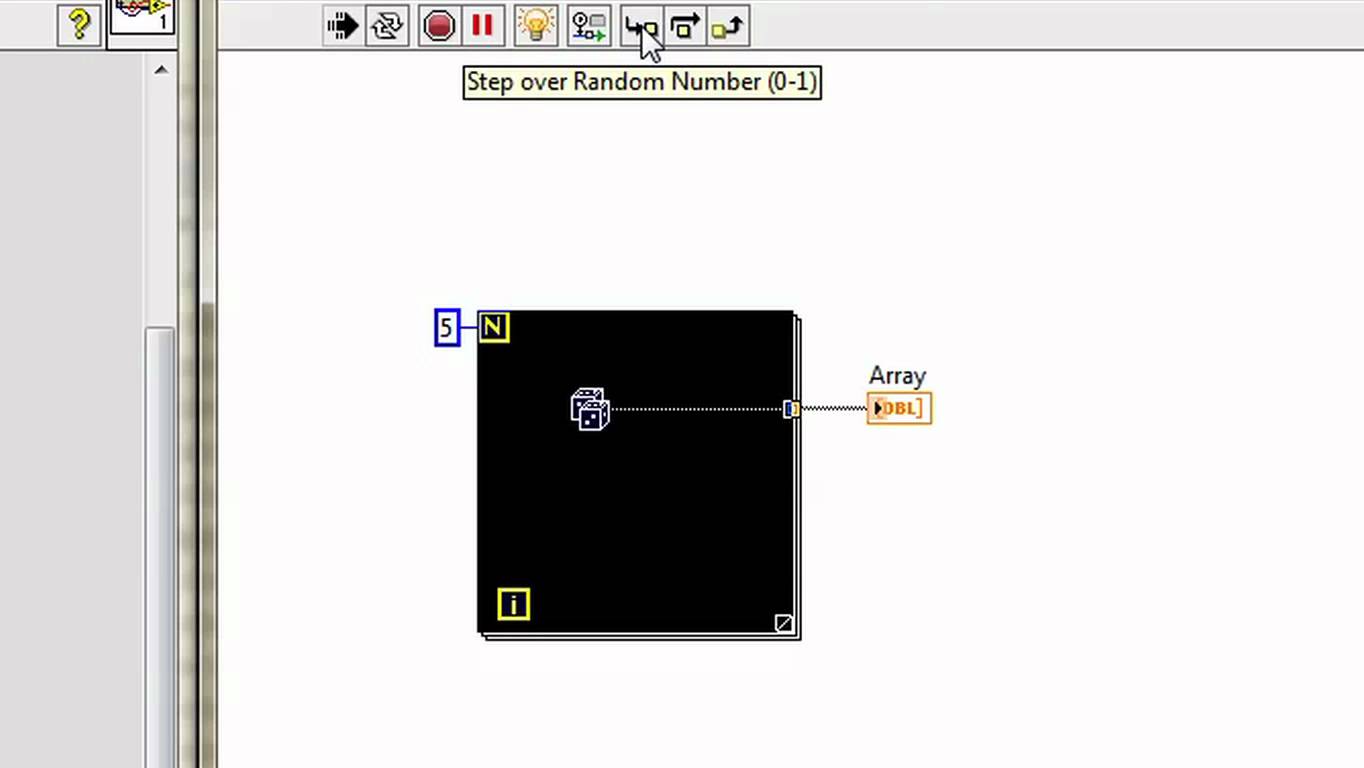
Now that you have a trigger.vi and a thinking.vi, lets make a dice.vi. We need to select a random number between 1 and 6 and then display it like a classic die. In the numeric palette there is a random number generator. This will output a decimal between 0 and 1.
NOTE - If you want a non-looping program to run continuously you can use the run continuously button located next to the run button (two curved arrows in a circle).
Activity: Making Faces
Use the random number generator and a case structure to show (light up LEDs) the numbers 1-6. Even though only 6 cases are possible, there still must be a default case in the case structure (choose whichever you want). Name this VI dice.vi. (HINT-keep in mind that the random number generator will output a decimal between 0 and 1.)
Solution
A random number generator in LabVIEw will generate a decimal between 0 an 1, which is then scaled and rounded to 1 to 6. This value is used in a case structure because every number has a distinct LED pattern.
digital-dice-faces-solution.vi

This generates a number between 1 and 6 and displays the appropriate dice face.
Putting It All Together
Now we will put the previous 3 VIs together. The reason you made them all as separate VIs with the same target is so that you can use them as subVIs. SubVIs will make your main program a lot cleaner. In the top right corner of each front panel there is a grid and an icon. You can use the grid to create inputs and outputs from your subVI. If you double click the icon you can create a custom icon for your subVI.
Activity: Making Faces
Use these to create inputs and outputs and give the subVI a custom icon.
Use a flat sequence to first initialize all the LEDs to off. Then enter a main loop with a stop button. Inside this loop, use the 3 subVIs you created. To add a subVI to your code, simply drag the file name from the project tree into the VI. To view or edit the code of the subVI, just double click the icon. Since in this case none of the VIs have inputs or outputs you will need a sequence to dictate the order in which they execute?
Solution
In all of the examples all the LEDs are turned off, then it waits, then it thinks, then it displays, and so on.
The solution with the custom SubVIs is much cleaner and easier to follow. One of the examples uses a flat sequence, the other uses boolean controls and indicators (data flow) to control the order of execution.
digital-dice-main_messy.vi
digital-dice-main_middle.vi
digital-dice-main_simple.vi

Without subVIs this code looks confusing, messy, and hard to follow.

SubVIs make this main program very simple and clear.

A boolean control and indicator for each subVI force the order of execution similar to a sequence.
Going Further
Visit Dr. E's Challenges to upload your own digital dice solutions, and see how others approached this project.
Here are some other cool project ideas that use the same basic principles as the digital dice.
- Make a visual countdown clock (draw each number in LEDs)
- Vary the image or flashing rate based on a variable resistor (light, temperature, pressure)
- Control which LED is on with the accelerometer
You can use a row/column method to create displays with more LEDs than ports. For examples and information on this click here.
Project 5: Audio Loop Station
In this handbook, you will use the audio in and audio out ports to create a loop station. You can record a sample of sound and then layer more sound on top of it.
For this project you will need:
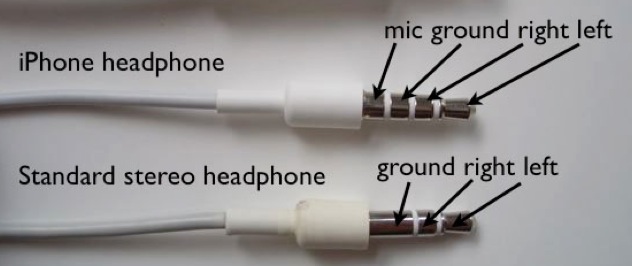
- A microphone (standard stereo 2 band only)
- Headphones or speaker
Any standard stereo microphone should work, I used both a Chuenyun CY-502 from the myRIO starter kit and a Rode VideoMic Pro.
The Basics of Sound

Waves travel through air as standing waves. Then, the moving air vibrates your eardrum and you brain interprets it as sound.

Audio waves are almost never a single amplitude or frequency. When we speak, the sound is composed of thousands of different frequencies and amplitudes.
The microphone used in this tutorial has 3 sections: left audio, right audio, and ground. The standard stereo audio jack functions as an analog input or output. An electric microphone uses a permanently-charged parallel plate capacitor to create a varying voltage as sound hits it. The battery powered microphone uses an impedance converter to do the same thing.
Microphones are capable of picking up sounds of all different frequencies, but humans are only capable of hearing within a certain range.
Viewing Audio Waves

Sound travels in standing waves.
Keep in mind that the microphone is outputting a voltage into the audio jack. This allows LabVIEW and the myRIO to interpret and record it. To record audio, we simply have to store all of the data points.
Activity: Audio Input

You can see the duration and intensity of the sounds.
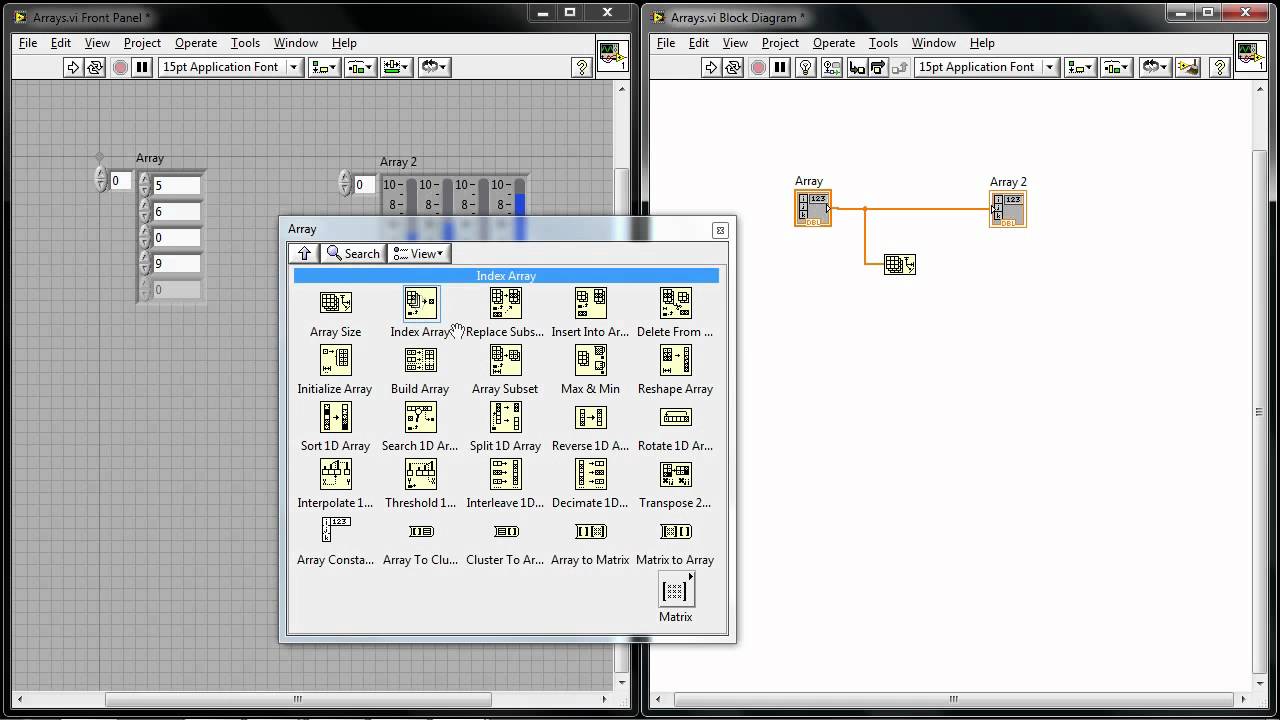
Create a VI that view the audio wave on a chart when a button is pressed. It should include a stop button. Keep in mind that the analog channels take arrays and not values. Use the index array function to convert from a 1 by 1 array to a double precision number.
The rate at which you choose to collect data will affect the visible waveform. Use a control or change the constant and see what happens.
Right click inside the chart and extend the chart length history to 4096 to remember more data points. Also, turning off autoscale on the Y axis and choosing the upper and lower bounds may help to visualize the sound waves.
Solution
Use a timed loop to take in samples. This will allow for a controllable constant rate. To trigger the timed loop use either an event structure or a while loop with a case structure.

This is the block diagram for viewing audio waves. I found 100usec to be a good sampling rate.
Storing Data
To store data for this activity we can use an array.
The easiest way to fill an array is with a loop. When you create an indicator outside of the loop and connect it to the data (indexed analog in) a small square will appear at the loop border. With this tunnel, you can output the last value (solid box) or all of the values (bracketed box).
Activity: Playing Recorded Sounds

Notice the exact same wave played back at the same speed.
Modify your original audio wave viewing VI to output all of the collected data from the loop to an array. It is now effectively a recording VI because you have a record of all the data. Right click on an indicator in the block diagram to hide it from the front panel.
Now make a similar loop that will output that array of data to the audio out port. Create a start and stop button for that as well. Make sure to record and play the data at the same speed otherwise the data will not sound the same. Use the build array function to convert from a double precision value to a 1 by 1 array.
This is possible without any sequencing because of data flow. The player can not play until the data array is created when the recording loop is finished.
Solution
The use of an auto-indexing loop tunnel allows arrays to be created and indexed easily. There are also data type conversions to work between arrays and double precision numbers.
Event structures can also be used.

This is the recording loop. It uses an autoindexing tunnel.

This is the playback loop. It uses an auto indexing tunnel.
Combining Audio

When adding waves of different frequency and amplitude there can be constructive and destructive interference.
To combine audio data we can add the data arrays. However, a sum operation of the two arrays will not work. Instead each element needs to be summed with its corresponding element from the other array.
Activity: Combining Two Tracks

The graphs are no longer necessary, but they give a visual interpretation of the incoming and outgoing data.
Record 2 different signals into 2 different arrays. Then combine the signals and output the results. When you listen to the combination you should be able to hear both sounds at the same time. Also notice that the noise volume has increased.
Solution
A stacked sequence allowed me to force the order of execution. This way, I am only dealing with full arrays of data. A sequence would not be needed if both arrays were initialized before the recording was done. A simple for loop with auto-indexing tunnels sums the elements of the array and outputs the results as one array.
audio-loop-two-waves-combining.vi

This records the first sample and stores it in array1.

This records the second sample and stores it in array2.

This sums each element of the two samples and stores them in another array.

This plays the combined array data array.
Infinite Looping and Clearing

This is the final front panel control interface for the loop terminal.
A loop station should be able to record more than just two sounds. This means that after each recording, the new data should be added to the playing data array and it should wait for the next record command.
Local variables will be very important in this section, as the below video describes:
Activity: Reseting the Loop Station

The user will specify the time to record. The stop recording and stop playing buttons are no longer needed. There is also now a clear array button to delete all sounds in the array.
To make things more consistent and to avoid possible memory issues, reconfigure your record and play loops to run for a controlled amount of time (maybe the user can specify how long).
In parallel with the other loops, add a clear array "function". When a button is pressed all of the data in the array is set to 0. Based on the user input for sample time, the program should know how many array elements there are.
To use information like frequency and period of a timed loop use the property node that automatically populates inside the loop on the left. To control them, use the terminals on the outside of the loop.
Solution
Now that the user is specifying the time to record, some simple calculations provide the program with how many array elements are needed. This is used when recording, playing, and clearing.

The stop button has been replaced with a loop counter. Also, notice the num elements indicator which states how many elements there are in the array.
This loop uses the number of elements to clear the entire array whenever the button is pressed.

The stop button has been replaced with a loop counter. Also, notice the num elements indicator which states how many elements there are in the array. Also, the signal has been multiplied by 5 to increase volume and plays out both audio channels.
Activity: Infinite Looping and Adding of Samples

This shows recording multiple sounds. It also has playback as it records.
Now that you can clear the array at any time, add functionality so you can add to the array at any time. The any time part should not be difficult, but how do you add it to the current array?
Also playback the current audio when recording so the user can hear what they are looping over.
Solution
Another for loop with auto-indexing tunnels allows for adding of recorded data to previous data. The programs goes through the old array then creates a new array called the same thing, essentially overwriting the old array. A flat sequence is used to ensure the correct order of execution. The entire thing has been surrounded by another while loop to allow for as many sounds as the user wants.
Also, the player will run simultaneously with the recorder so the user can hear what they are recording over.
audio-loop-infinite-autoloop.vi

The for loop will overwrite the old array with the sum of the old array and the new array.

The new audio player will run while the record loop runs so the user can hear what they are recording over.
Going Further

You can use a fast fourier transform [FFT] to filter out waves of certain frequencies.
Visit Dr. E's Challenges to upload your own audio loop solutions, and see how others approached this project.
Here are some other cool project ideas that use the same basic principles as the audio loop station.
- How can you distort the sounds?
- Use a fast fourier transform to view the frequencies
- Can you filter out the background noise?
- Use a variable resistor to control the volume of output audio
Project 6: myRIO WebSocket

This webpage is able to connect to a networked myRIO via a WebSocket. Commands and information can be transmitted back and forth, allowing interaction with a myRIO remotely over a wireless connection.
What Are WebSockets?

The myRIO and this website will communicate over a TCP WebSocket.
To communicate with networks and devices computers use ports. The port we will use for WebSocket communication is number 6123 using a Transmission Control Port (TCP for short). A protocol is a system of rules that two or more things use to communicate. Normally, you will need to program both sides of the connection, but we have already done the web-based portion for you.
Getting WebSockets for your myRIO

Once downloaded the WebSockets API can be found under the Data & Communication functions palette.
There are a few simple steps for getting TCP WebSockets to work with your myRIO.
- Download and install the latest version of WebSockets for LabVIEW.
- When targeting a myRIO, you should see the WebSockets SubVIs under the Data & Communication functions palette.
- Download the VIs attached to the right. (You need the API from step 1 for these to work)
- Configure your myRIO to work on a wireless network (any wireless network except the locally hosted myRIO web server) and figure out the myRIO's IP address.
These WebSockets will be able to send strings and JSON files back and forth.
Web LED Control
For each top level VI (the main controller) you want to connect with a WebSocket you will have to set up the connection and end the connection. The set of VIs downloaded from here will take care of that for you. There is also a special read and write VI that has been created to make the WebSocket interface more intuitive. Normally if you wire a read then a write the program will wait for a read before it writes. However, this VIs will check for a read and a write at the same time to allow for constant reading or writing without relying on a predetermined order.

You will always have to setup and close the WebSocket. Use this format to reduce the chance of improperly closing the WebSocket.
The connection can take up to 3 minutes to close if not closed properly so if you get an ERR(60) just wait a few minutes and try again. You can also create a loop so every time it closes it shuts down properly and can restart sooner.
Activity: Hello World
Write a VI that starts a WebSocket and writes "hello world" over that WebSocket once per second while the myRIO's onboard button is pressed. Also include an indicator so you can type strings to the myRIO via the web client.
Solution
This solution uses the basic infrastructure seen above. The WebSocket is set up and then enters a loop waiting for the button to be pressed. When pressed, the myRIO sends "hello world" which can be seen in the web client every second while the button is pressed. If anything has been typed in the web client during that time it will be visible as well. There is a button to shut down and to close the current WebSocket.

This uses the basic infrastructure to read and write with a WebSocket
Activity: WebSocket LED Control
To turn on virtual LED1, send "LED1on". To turn it off send "LED1off".
Write a VI that can toggle LED1 on the web client using the button on the myRIO. You should also be able to turn on the myRIO's LED1 from the web client. Right click on the write data control and select limit to one line.
Best results will come from sending and receiving between 2 and 4 signals per second.
Solution
This solution uses the basic infrastructure to send and receive via a WebSocket. The data that is read in is fed into a case structure to turn on or off the light. Remember the command for the web client LEDs is LED1on or LED3off etc.

The read data is fed into a case structure which turns on or off the light.
Web Graphing
The web client uses JavaScript to read and write strings with the myRIO. The WebSocket can also be used to graph data. For this, JavaScript uses JavaScript Object Notation (JSON) files. There is a convenient "flatten to JSON" SubVI in LabVIEW.
Activity: Graphing the Accelerometer

The graph data can be sent over the web via a WebSocket.
Write a VI that plots the myRIO's 3 axis of accelerometer data on one chart. Then use the "flatten to JSON" and write the cluster over the WebSocket. A graph should appear on the web client of each axis' current acceleration.
Solution
The accelerometer data on each axis is measured and then clustered together. The cluster is then flattened into a JSON file to be read by JavaScript. That JSON is sent as the data over the WebSocket.

The accelerometer data is clustered and flattened to a JSON file before being sent over the WebSocket.
Adding WebSockets to Projects
The added functionality of WebSockets allows for an external wireless myRIO controller or another user interface. This gives more options for how to control the myRIO moving forward. First, lets go back to some of the first projects of this handbook and add these capabilities.
Activity: Adding WebSockets to the Binary Counter
Go back to the binary counter project. Open the VI and save it with a new name. Then replace the 4 front panel virtual LEDs with the 4 web client LEDs. Also include a case to reset the counter from the webclient.
Solution
This program has the same loop as the original file, just placed inside the WebSocket infrastructure.
It now has a write to turn on and off every web LED. It will also reset the counter if it reads "reset". There are a lot of OR clauses to stop reset the loop: a web reset, a front panel reset, a push button, or an ended WebSocket connection.

The main controller. This contains the WebSocket Setup and a call for the check num subVI.

This checks to see if divisible and if so subtracts the correct amount. It is the same as before just reconfigured in a subVI.
Activity: Adding WebSockets to the LED Level
Now do the same thing for the LED level. Use the web LEDs and the WebSocket graphing capabilities. Remember to flatten the graph data to a JSON string so the web client can interpret it.
Solution
In each loop iteration the status of each LED is written over the WebSocket in addition to a JSON with the accelerometer data. The program can receive data but will not do anything with it.
An indicator of the accelerometer data and LED status cluster show on the front panel to aid in debugging.

This will send LED status and accelerometer data over the WebSocket.
Going Further
With web enabled VIs, your myRIO can do all sorts of cool things. Here is another WebSocket web client and some cool project ideas to try.
- Use the web LEDs as status lights
- Control the order of multiple LEDs lighting up from the web to create a light show
- Graph a variable resistor
- Control the brightness of an LED from the web
- Control the color of LED from the web
Project 7: Ball Balancing
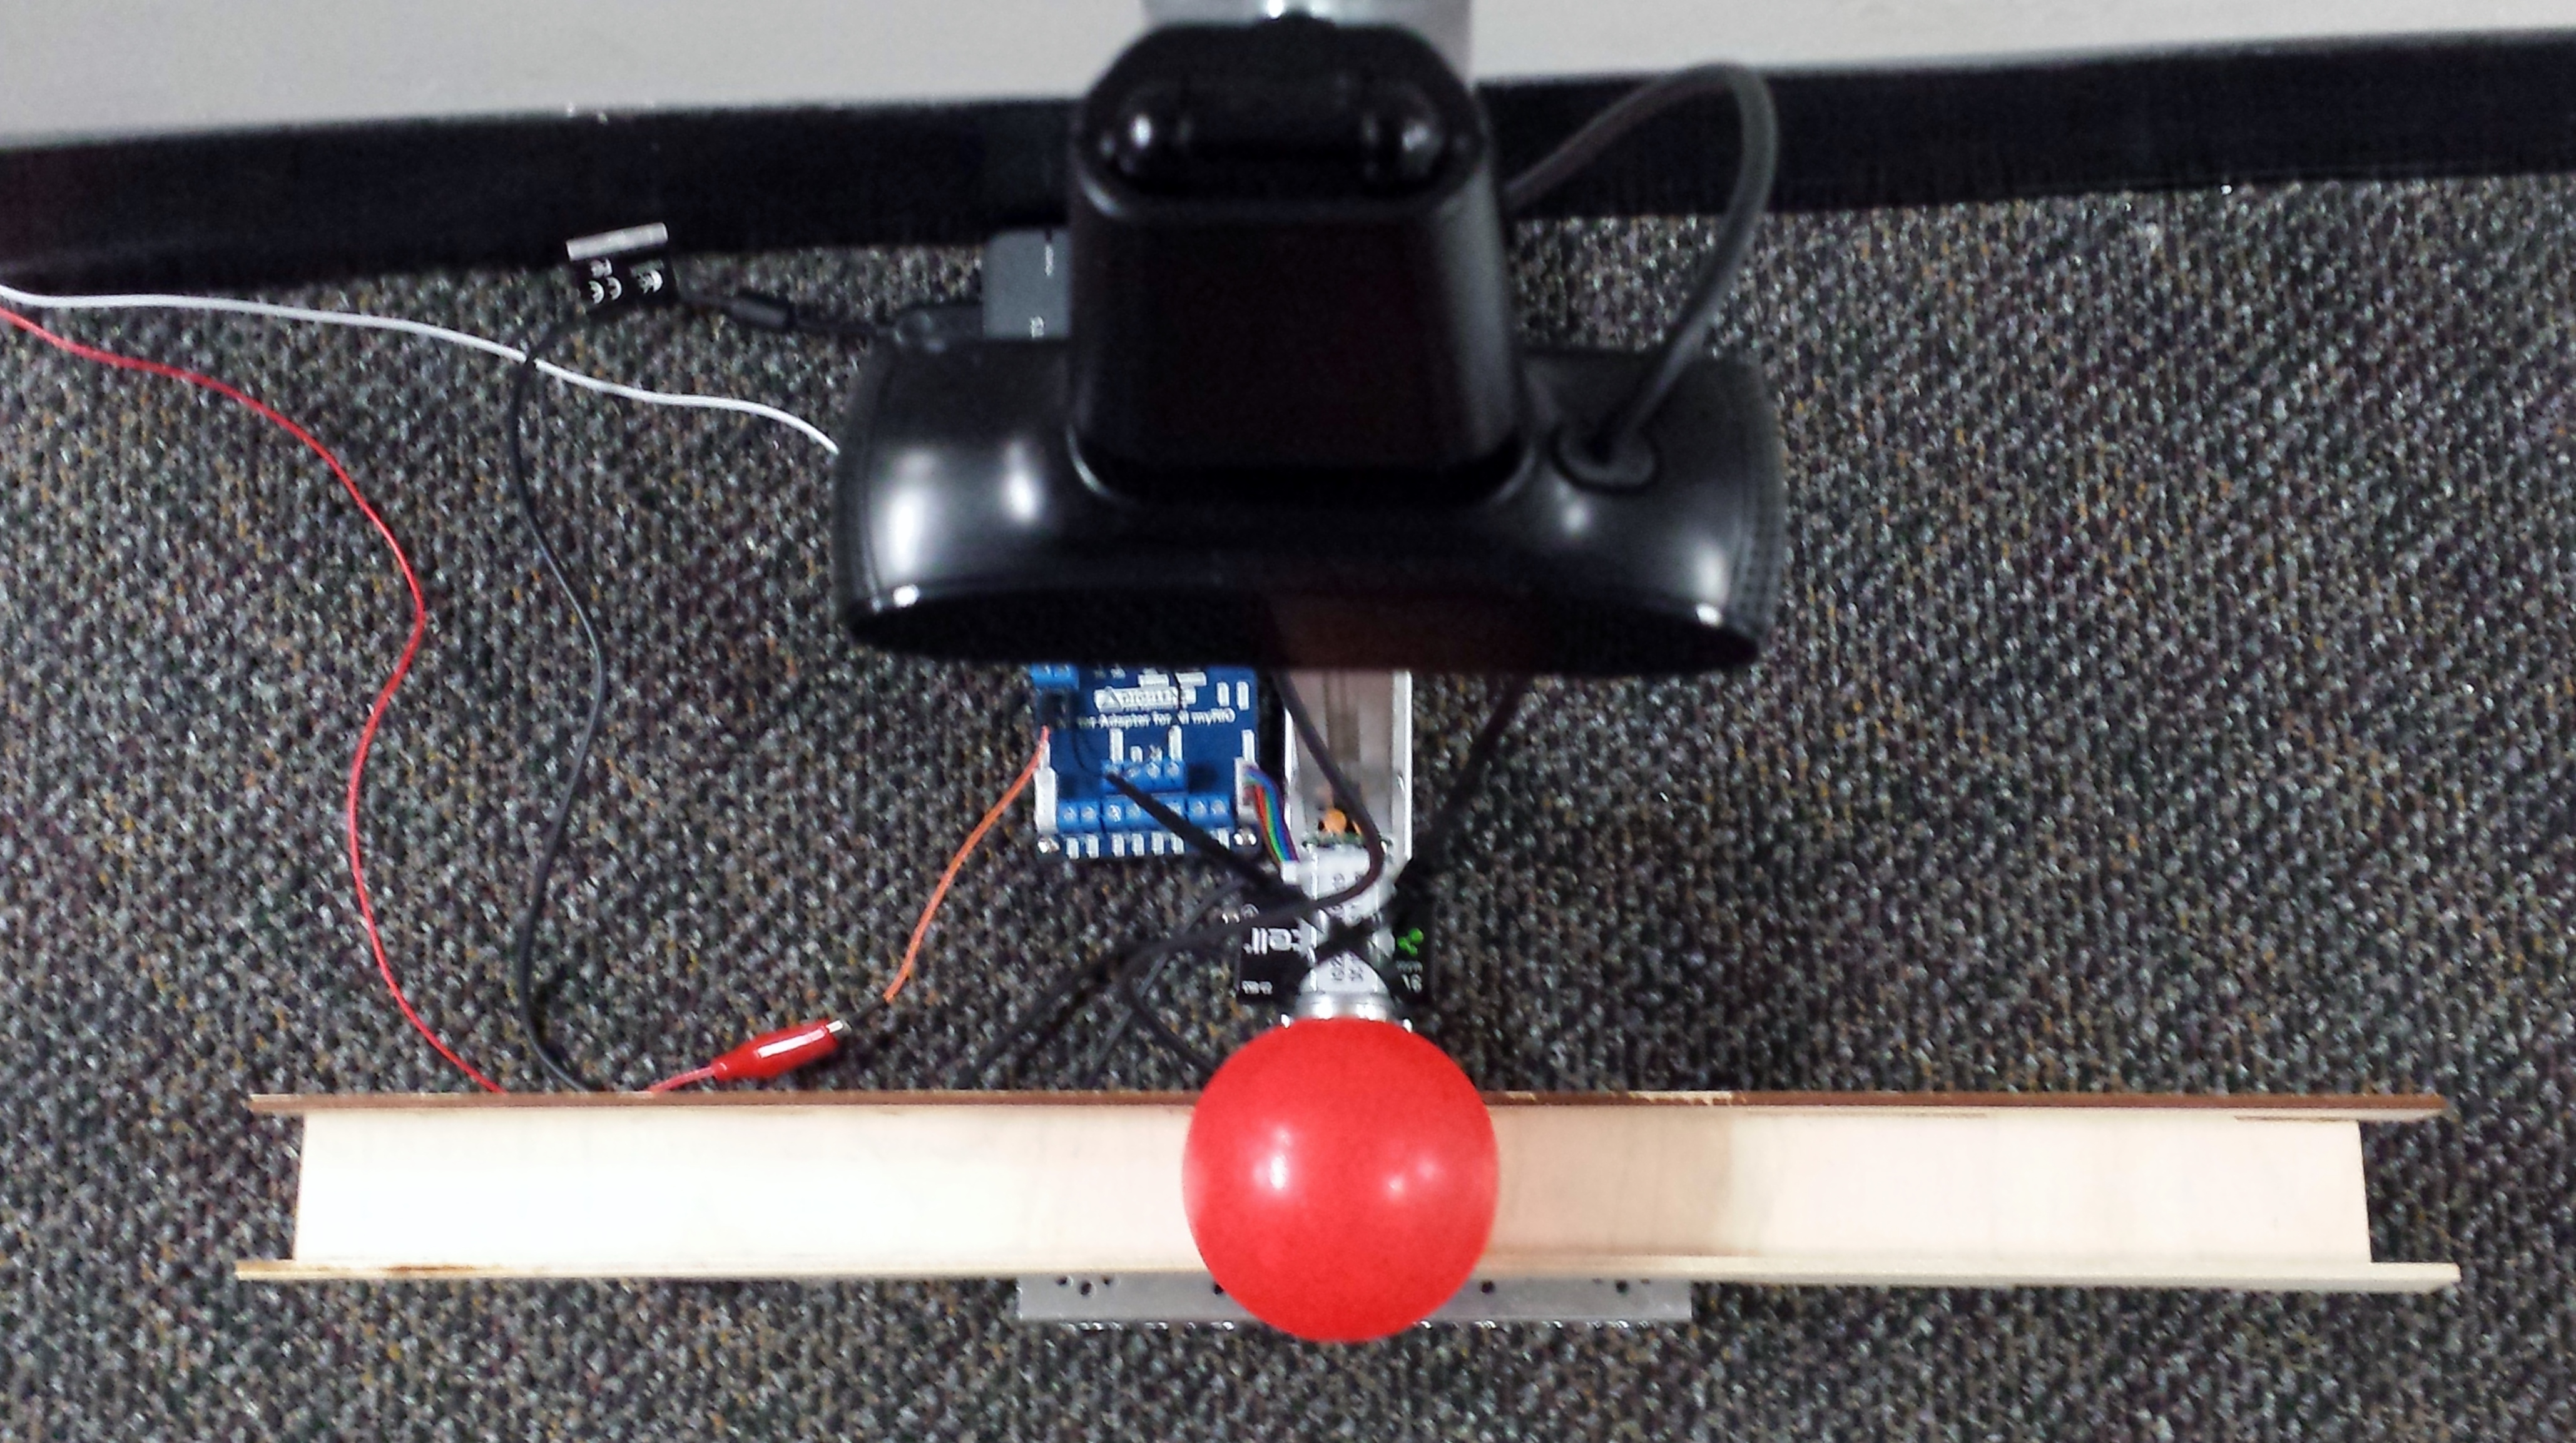
This project will involve image processing and PID motor control. Documentation for this project hasn't been completed yet, but feel free to try to make this on your own!