

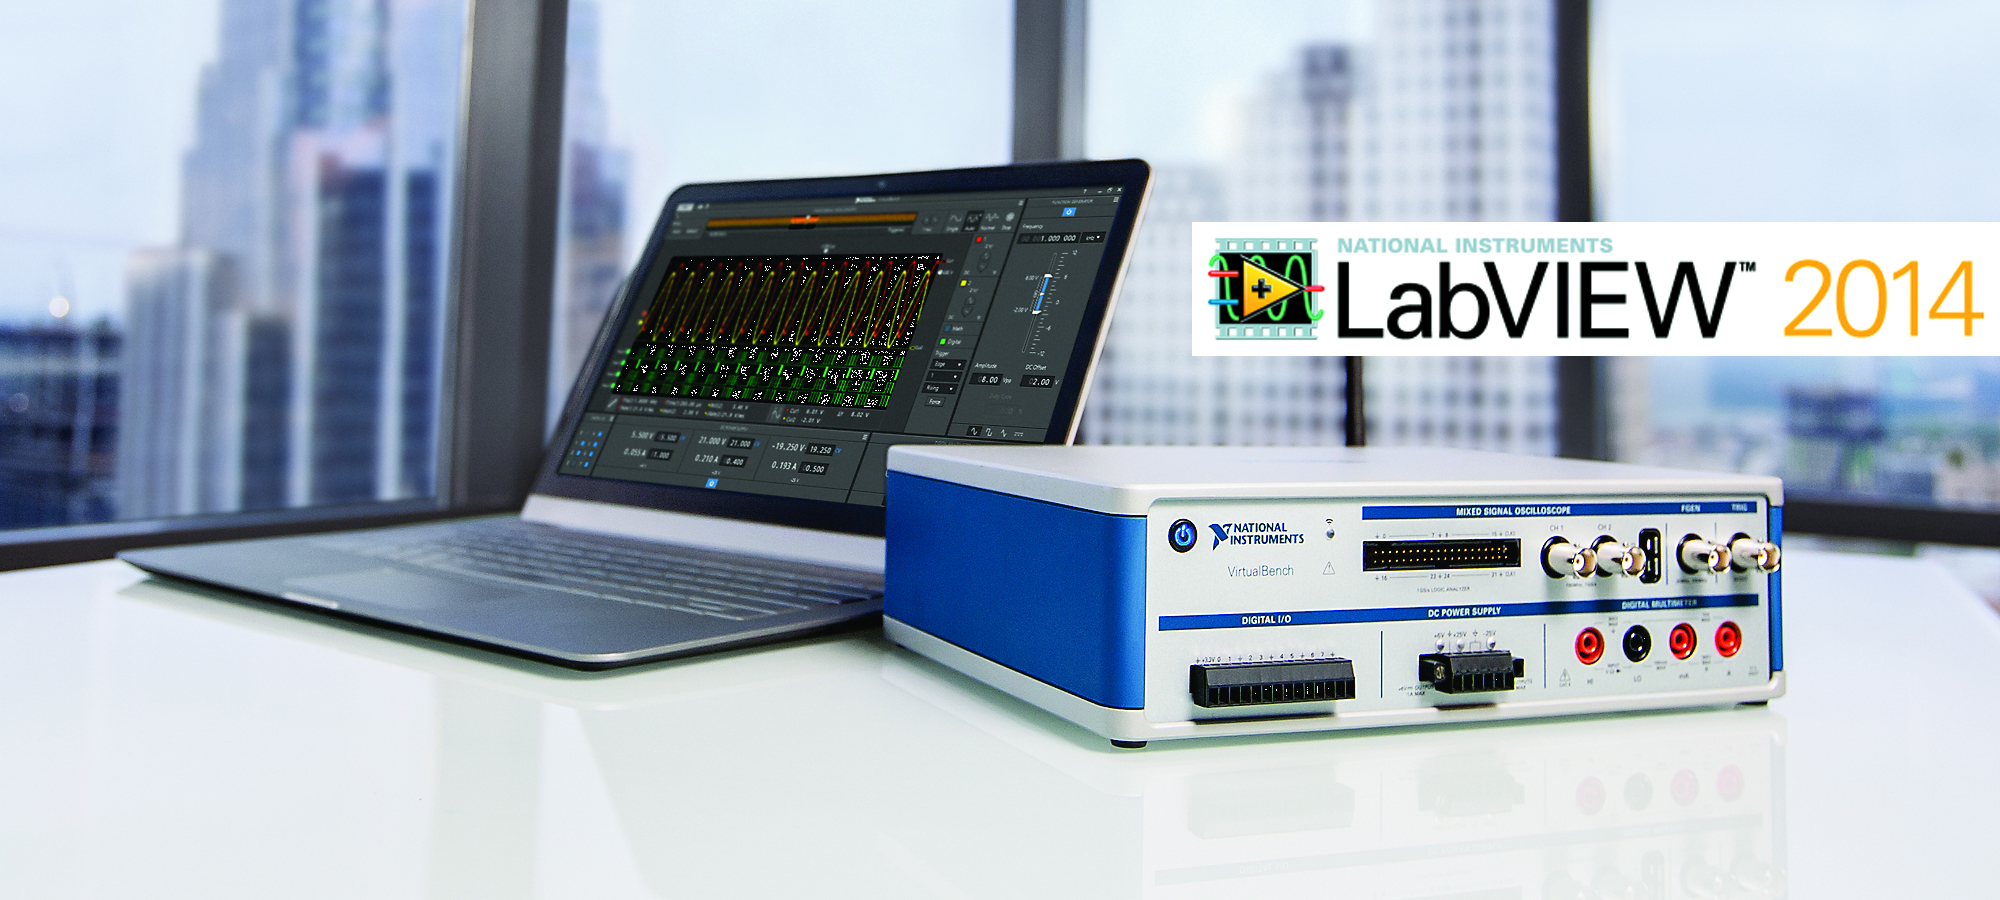
Virtual Bench
This handbook contains Virtual Bench tutorials and activities.
Basic Measurements
The following guide will walk you through the basic capabilities of your virtual bench and the basics of measuring signals.
PC Interface
When you plug in and turn on the virtual bench it should automatically open software on your computer. Mouse over any of the icons in the Virtual Bench Interface for more information on what the button or display does.

This is the PC interface for the Virtual Bench.
iPad Interface
Download this app and connect your iPad and virtual bench to the same WiFi network.

This is the iPad interface for the Virtual Bench.
The DC Power Supply
The virtual bench has a variable DC power supply capable of producing constant voltage and current up to 25V. To use the power supply simply enter in the desired voltage (one is 6V max and the other two are 25V max) and press the power button on the interface. Little blue lights should appear. Use the screw terminals to attach wires. The 6V port can deliver currents between 0.1A and 1A. The 25V ports can deliver between 0.1 and 0.5A.

This is the DC power supply capable of voltages up to 25V.
If the interface says CV that means it is outputting as close to the voltage as it can. If it reads CC it is outputting as much current as it can to reach the desired current (but probably less than the desired voltage).
The Function Generator
The virtual bench has a built in function generator. This will allow you to generate different waveforms (sine, square, triangle and constant).

A sine wave curves up and down, a square wave is either high or low, and a triangle wave uses only linear increases and decreases.
Here is some basic function generator vocabulary.
Frequency - The number of oscillating cycles per second
Amplitude - The distance from the highest peak to the lowest trough
DC Offset - How far from 0V is the middle of the wave (A wave with an amplitude of 2Vpp and a DC offset of 1V will oscillate between 0V and 2V)
Duty Cycle - Percent of a square wave's cycle that is outputting high
Symmetry - Percent of the triangle wave that the signal is rising
Use the slider or input boxes to create the wave you need and then press the power button at the top of the function generator section of the interface.
The Digital Multimeter
The digital multimeter in the virtual bench works like any other. The multimeter has an autoscale feature which works well to give you the most accurate reading without any guesswork. The multimeter can read voltage (DC and AC), current (DC and AC), resistance, diode, and continuity.

With the multimeter you can measure voltage [DC and AC], current [DC and AC], resistance, and continuity. It can also perform diode tests.
- To measure voltage wire up the leads of the multimeter in parallel with your circuit.
- To measure current wire up the leads of the multimeter in series with your circuit
- To measure resistance tap the leads on any 2 wires to see the resistance between those 2 points
- To conduct a diode test turn off all power in your circuit and connect the leads on either side of the diode. The multimeter should read different things in each direction. If they read the same you have a bad diode.
- To conduct a continuity test turn off all external power and touch the leads of the multimeter at any 2 points. The readout will tell you if they are electrically connected.
The Digital Input and Outputs (DIO)

This palette will display the current state of the digital input and output lines. The menu is in the top left
A digital input and output line can read or write two values, on or off. The logic threshold is set to 3 volts, which means anything greater than 3V will register as true and anything less will be false.
Activity: Digital Communication
Connect a wire from digital line 0 to digital line 1. Also connect the long end of an LED to digital line 0 and the shorter end to ground (triangular symbol).
Now toggle the state of digital line 0 by setting it to an output (done through the menu in the corner). The light should turn on when true and off when false. The state of line 1 on the computer interface should also mimic the output of line 0.
The Oscilloscope
The Virtual Bench also contains a mixed signal oscilloscope. An oscilloscope is used to display an electrical signal over time. The probe has 2 parts, a measuring end and a grounding clip. The spring loaded clip attachment can be removed to also use a probe (pin). Connect the oscilloscope probe to your circuit and press the auto button in the top left. This will automatically adjust the display to best suit your circuit. Use the measurement and cursor settings to display more information about the signal.
Watch this quick 1 minute video for a basic introduction.
Putting It All Together
Here we will use some of the Virtual Bench's features in an exploration of signals.
Activity: Using the Function Generator and the Oscilloscope

Construct a circuit following this schematic for the activity.
Now we will use the function generator and oscilloscope in one experiment.
Create the attached circuit. Notice that the LEDs are in different directions.
Generate and connect a square wave with a slow frequency (I used 1Hz) and a large enough voltage to light up your LEDs. (This will depend on what resistances you use, I used 10kohm and 24Vpp). If you set it up correctly, the light should flash on and off. Connect the oscilloscope to view the wave.
Now change the settings and view the response.
- What happens if you change the frequency?
- What frequency is needed to make both LEDs appear on?
- What happens if you change the duty cycle?
- What happens if you change the offset?
Now change the type of function to a sine wave. The lights should fade on and off. Why is this? What happens if you use a triangle wave?
Going Further
Now that you are used to the Virtual Bench interface, feel free to swap it in for any project involving a power supply, mulitmeter, oscilloscope, etc. It is a great space saver that is nice to always have on your lab bench.
Virtual Bench Automation
The Virtual Bench can also be automated through LabVIEW. This allows it to coordinate multiple signals, output custom signals, and run logic based tests.
Virtual Bench API
In order to control the virtual bench you will need LabVIEW and the Virtual Bench drivers.
If you have never used LabVIEW please refer to the Introduction to LabVIEW section.
Create a new VI under the "My Computer" target in a blank LabVIEW project.
The Virtual Bench VIs are located on the Functions Palette of the block diagram under Measurement I/O then VirtualBench. There is a set of VIs for each instrument. Each instrument will have at least an initialize, a configure, and a close. It is important when dealing with measurements that you run your code in a specific order to reduce memory usage and keep your program efficient.

This is a good order to execute instrumentation code.
More information on setup and environment can be found here.
Power Supply and Digital Multimeter

These VIs control the multimeter interface.

These VIs control the DC power supply interface.
The DC power supply is fully controllable with LabVIEW. After initializing the channel, configure the output with the desired specs. Then enable the power supply. Once enabled, the "read output" VI will output the actual values coming from the DC power supply.
The DMM (digital multimeter) works similarly. The "configure measurement" will dictate which measurement type the DMM will read. Use the function control terminal to choose an input. The read function will read multimeter value.
Activity: Basic Testing

This shows the desired output [power supply], actual output [power supply], and measured output [DMM].
Write a VI to output a constant voltage and then measure it with the DMM. Wire the power supply ports to the DMM.
Compare the desired voltage to the actual output voltage (both on the power supply) to the DC voltage measurement on the DMM.
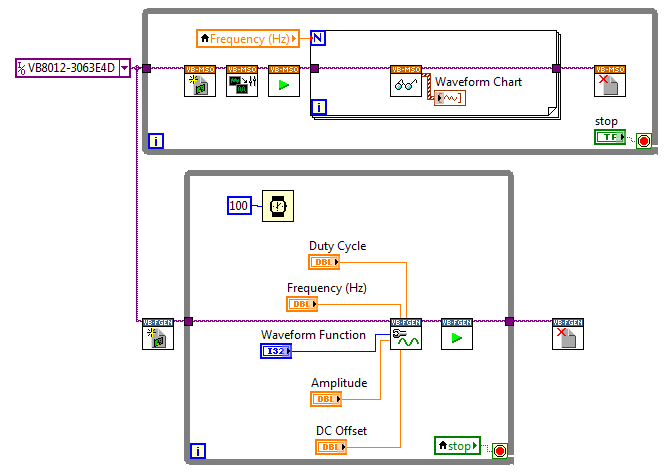
Solution

This controls the DMM. It configures a DC voltage read.

This controls the Power Supply. It configures a DC voltage output and then reads the actual ouput.
Both channels are initialized to the same Virtual Bench ID and then enter the input/output loop.
The power supply is configured and outputs, then reads back the actual values. The DMM reads the DC voltage (or whatever the user desires). When the stop button is pressed both loops end.
Digital I/O with LabVIEW

These VIs control the DI/O interface.
Just like the multimeter the digital input and out put lines can also be controlled via LabVIEW. This allows for more specialized uses of the DIO. Instead of a manual on/off control, you can use LabVIEW to make decisions and turn on of off DIO lines.
Activity: Digital I/O with LED

This will control the LED from DIO 0 to ground and the input of DIO 1.
Connect a wire from digital line 0 to digital line 1. Also connect the long end of an LED to digital line 0 and the shorter end to ground (triangular symbol).
Now create a VI where you can toggle the state of digital line 0. The light should turn on when true and off when false. The state of line 1 should be shown on the LabVIEW front panel with a boolean indicator.
Solution

This will control the LED from DIO 0 to ground and the input of DIO 1 with a user input button.
The indicator channel (1) is declared and read. The result is wired to an indicator.
The control channel (0) is declared, initialized, then written to with a control.
NOTE both the DIO write and read take arrays of boolean values. You may have to expand the "array" on the front panel to get rid of errors. To do so simply stretch the control or indicator down to view more elements.
Function Generator

These VIs control the function generator interface.
The function generator in LabVIEW works very similar to the Virtual Bench Application. The "configure standard waveform" VI will create a standard wave just like before (either sine, square, triangle, or DC). The run VI will turn on the function generator. The "configure" set of VIs allows for more complex and non-standard functions.
Activity: Using the Function Generator

Construct a circuit following this schematic for the activity.
Now we will attempt to recreate the final activity of the last section using two opposite facing LEDs. Create the attached circuit. Notice that the LEDs are in different directions.
Generate and connect a wave with a slow frequency (I used 1Hz) and a large enough voltage to light up your LEDs. (This will depend on what resistances you use, I used 10kohm and 24Vpp). If you set it up correctly, the light should flash on and off. The front panel should control all aspects of the generated signal.
Now change the settings and view the response. Is it the same as before? Be sure to toggle all the setting to make sure the program is correct and your LEDs are behaving the way you expect.
Solution

This VI will act the same as the Virtual Bench application for the function generator.

This is one way of displaying the user interface.

This is another way of displaying the user interface.
The function generator channel is opened, then the program loops through configuring the wave and outputting it. When the stop button is pressed, the loop exits and the channel is closed.
The front panel and be configured many ways.
Oscilloscope

These VIs control the oscilloscope interface.
Automating the oscilloscope will give your virtual bench much more customizable functionality. The auto-setup will automatically configure the oscilloscope to the best settings for its current use. If you know the range of what you are trying to measure there are more complex setup VIs in the "configure section". In this section you can also control triggers digital thresholds and more.
To use the oscilloscope you have to first initialize the session and setup the device. Then use the run VI to turn on the device. The read signal will read 1 signal, so make sure to read enough times to get at least one cycle. Always remember to close the session.
If you are using auto-setup you will need to run that VI every time the signal changes.
Activity: Viewing Signals

The function generator is outputing a signal and the oscilloscope is showing it.
Use LabVIEW to produce a signal out the function generator and view it with a waveform chart using the oscilloscope. Use local variables to control data in parallel loops.
Solution
The function generator loop is the same as in the previous activity.
The oscilloscope is reseting after each period of the wave coming out of the function generator. This allows the oscilloscope to configure itself with the current waveform to allow it to change as the signal changes.
If you do not want to use a frequency based for loop you can also create a reset button and a while loop.
Going Further
There are lots of cool and innovative things you can do when controlling the Virtual Bench with LabVIEW. Think about different ways to trigger events and modify signals without having to touch the controls.
Physical Controller for the Function Generator Interface
Automating the Virtual Bench with LabVIEW to create a physical controller for the function generator. Wave type, amplitude, and frequency can all be adjusted via various external sensors/resistors.
Building the Circuits

Construct a circuit following this schematic to view the function generator for this activity. I used 10Kohm resistors.

Construct a circuit following this schematic as the controller for this activity.
For this activity we recommend:
- 2 LEDs
- 2 10kohm resistors
- 1 pushbutton switch
- 1 potentiometer
- 1 16 position DIP rotary switch
- jumper wires
- breadboard
This project will use one circuit to control another. The first will display the function. It uses two LEDs facing different directions and 2 resistors. (The same as in previous activities, I again used 10Kohm.)
The second circuit will be the controller. This can be located on a different board or next to the first circuit.
Testing Before Automation

This is the PC interface for the Virtual Bench.
The key to any complex project is to work in steps. To make sure the circuits are properly connected, you should test them using the standard Virtual Bench software. Watch the digital inputs and press the button, then move the rotary DIP switch. Try measuring the resistance of the potentiometer as it turns with the multimeter. The switch should turn on or off the indicator. The rotary DIP switch controls 4 indicators, representing 1 2 4 and 8. This gives 16 possible values (referred to as 16_POS in the schematic above). The potentiometer should change resistances as the knob is turned.
The LEDs should turn on and off when you turn on the function generator. What happens when you change the frequency, amplitude, and duty cycle?
Do not move on until the circuits are all working as expected.
Controlling the Type of Wave

A sine wave curves up and down, a square wave is either high or low, and a triangle wave uses only linear increases and decreases.
The first thing we will control is the type of wave. There are many ways to do this. For this project we will use a push button to cycle through sine, square, and triangle waves.
Activity: Automating the Function Generator
Use LabVIEW to automate the function generator. For now, use a constant sine wave with a frequency of 1HZ and an amplitude of 24Vpp. These constants will all be replaced by variables controlled by the sensors and resistors.
Solution

This is the standard wave that will be modified later.
This is the standard function generator VI. It is initialized with the device and then configures and runs until the stop button is pressed. The frequency is 1 cycle per second and the amplitude is 24Vpp.
Activity: Switching Waves with the Push of a Button
Write a VI that uses the digital inputs to see the status of the switch. Use that change in status to trigger a new type of wave. The wave type constant is no longer needed. Every time the button is pressed you should see a new type of wave on the LEDs.
Solution

This will cycle between the different types of waves when the button is pressed and released.
Every loop iteration the button status is checked. If it is different than the last time a counter is incremented. This means for every press and release the count will go up two. There are 3 waves so if the count goes above 5 it resets to 0.
Then a local variable determines the case for which type of wave to input into the function generator. A simple string constant and indicator publishes the signal type to the front panel.
Viewing the Signals
Now we want to view the wave forms we are outputting. To view a periodic (repeating) signal, you use an oscilloscope. Connect the oscilloscope probe to the same connections as the function generator.
Activity: Automate the Oscilloscope

Here you can view the different types of waves with the oscilloscope.
Use LabVIEW and the Virtual Bench's oscilloscope to view the periodic signal output by the function generator. Refer to the Automating Virtual Bench chapter if you need help.
You should sample at least the frequency of the output per main oscilloscope loop. (Use a hidden indicator and local variable)
Solution

This uses a local variable to make sure enough samples are taken from each signal.
This is the same as in the previous activity except it uses a local variable to control the frequency.
Changing the Frequency

The frequency is the cycles per second.
To change the frequency of the wave we will use a potentiometer. A potentiometer is a variable resistor that increases or decreases in resistance as it is twisted. It has three terminals: power, ground, and output.
Activity: DMM Controlled Frequency
Use the Virtual Bench's digital multimeter to measure the resistance across the Vin and output terminals. It will have a different range depending on your potentiometer. Use LabVIEW to take the resistance measurement and convert it to the frequency of the function generator. You may need to multiply or divide the resistance by a constant.
Keep in mind that a frequency over 50Hz is almost impossible to make out with the human eye.
Solution

The digital multimeter controls the frequency.
The digital multimeter measures the resistance. That value (because it is often very large) is scaled down by a factor of 100 before being used as the frequency for the signal generator. This will also now control the number of samples collected by the oscilloscope.
Changing the Amplitude

The switch has 4 terminals representing 1 2 4 and 8.
To change the amplitude we will use another type of switch, a rotary 16 position DIP switch which has 6 pins. FromCounter-clockwise from top left (denoted by a dot or notched corner) the pins are [1 Vin/GND 4 2 Vin/GND 8]. This type of switch works in binary. If you add the values from the 4 pins you will get the position number. 8+4+2+1 is 15 positions plus when they are all false is 16 total.
Activity: Switch Controlled Amplitude
Interpret the four binary terminals with LabVIEW to obtain a number from 1 to 16. Then scale or bound the number so it ranges from 0 to 24. (You can give a wire bounds by using the in range and coerce function in the comparison palette) If you do not restrict the number between the min and max voltages the function generator can handle LabVIEW will give you an error when you try to run.
Solution

This interprets the 16 possible switch positions and controls the amplitude of the wave.
To interpret the 16 positions this VI reads each one and adds the appropriate amount to a sum if the pin is reading high. This will give a value between 0 and 15, which is then fed into the signal generator loop.
The voltage of the signal can range from 0 to 24 so the DIP value is multiplied by two and then bound between 0 and 24.
Working Design

This controls 3 aspects of the wave and views it on the front panel with the oscilloscope.
Now you should have a working external controller for the Virtual Bench. It uses 3 different trigger types to control 3 different aspects of a signal generator which you can view live with an oscilloscope, all with one piece of hardware!

This controls 3 aspects of the wave and views it on the front panel with the oscilloscope.
Going Further
Now that you have created an external Virtual Bench controller it should be easier to leverage the Virtual Bench's full capabilities. Some more project ideas are listed below.
- Model a traffic light
- Reduce noise from an audio signal
- Make a physical controller for a motor using the DIO and a PWM square wave