Creating a Picture using Functions
Create a visual picture by graphing a series of functions. Students should choose some image to recreate and then use various different functions to graph out the picture. Multiple functions of different types should be utilized within the project and a list of all of the functions used should be included. Students can use a variety of different functions however many times they want, but they must use at least five types of equations from the following list:
Vertical
x = m
Horizontal
y = m
Linear
y = mx + b
Elliptic
Parabolic
y = a (x – h)^2 + k
Hyperbolic
Power
y = a (x^b)
Logarithmic
y = log x
Exponential
y = a^x
Sinusoidal
y = sin x y = csc x
y = cos x y = sec x
y = tan x y = cot x
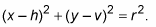
Semicircular
y=

Circular
Authors: Rose Solow and Orian Sneor
Final Project
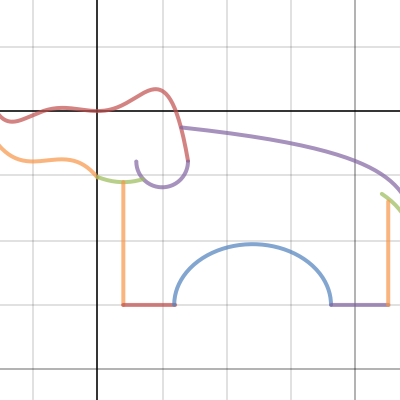
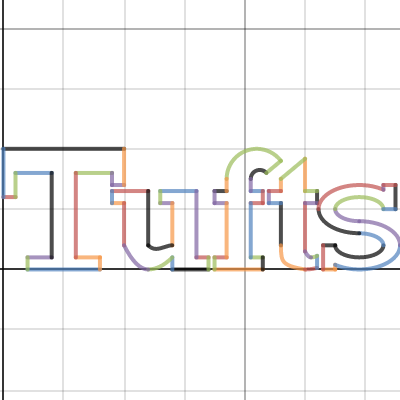
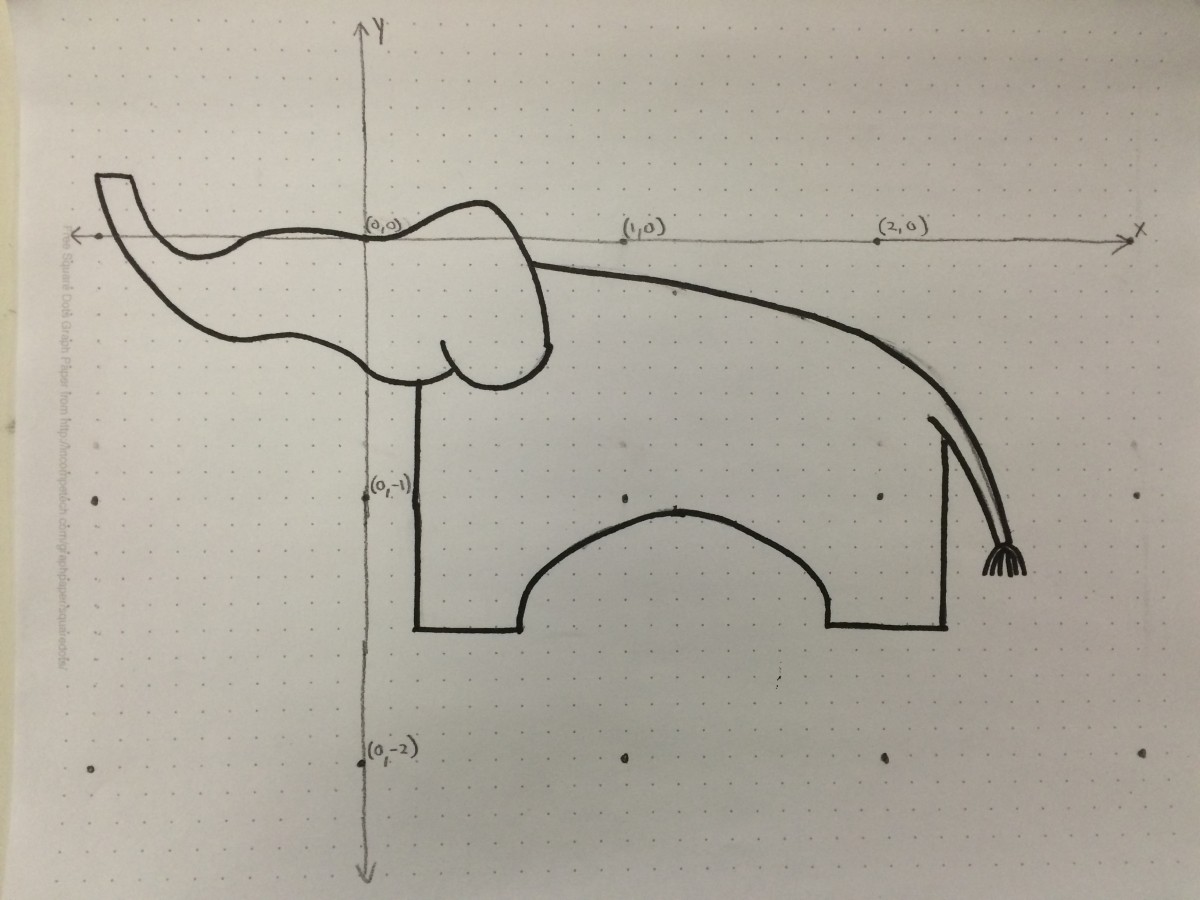
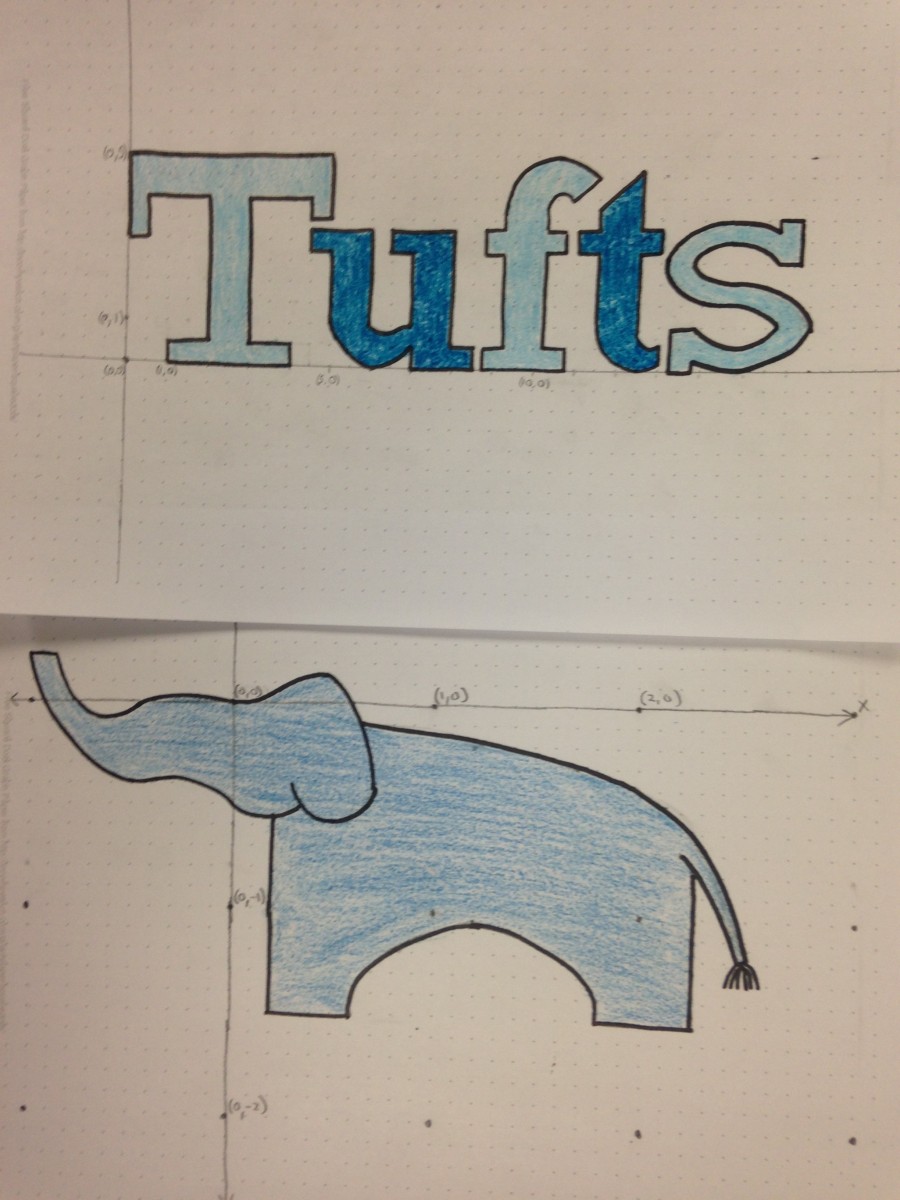
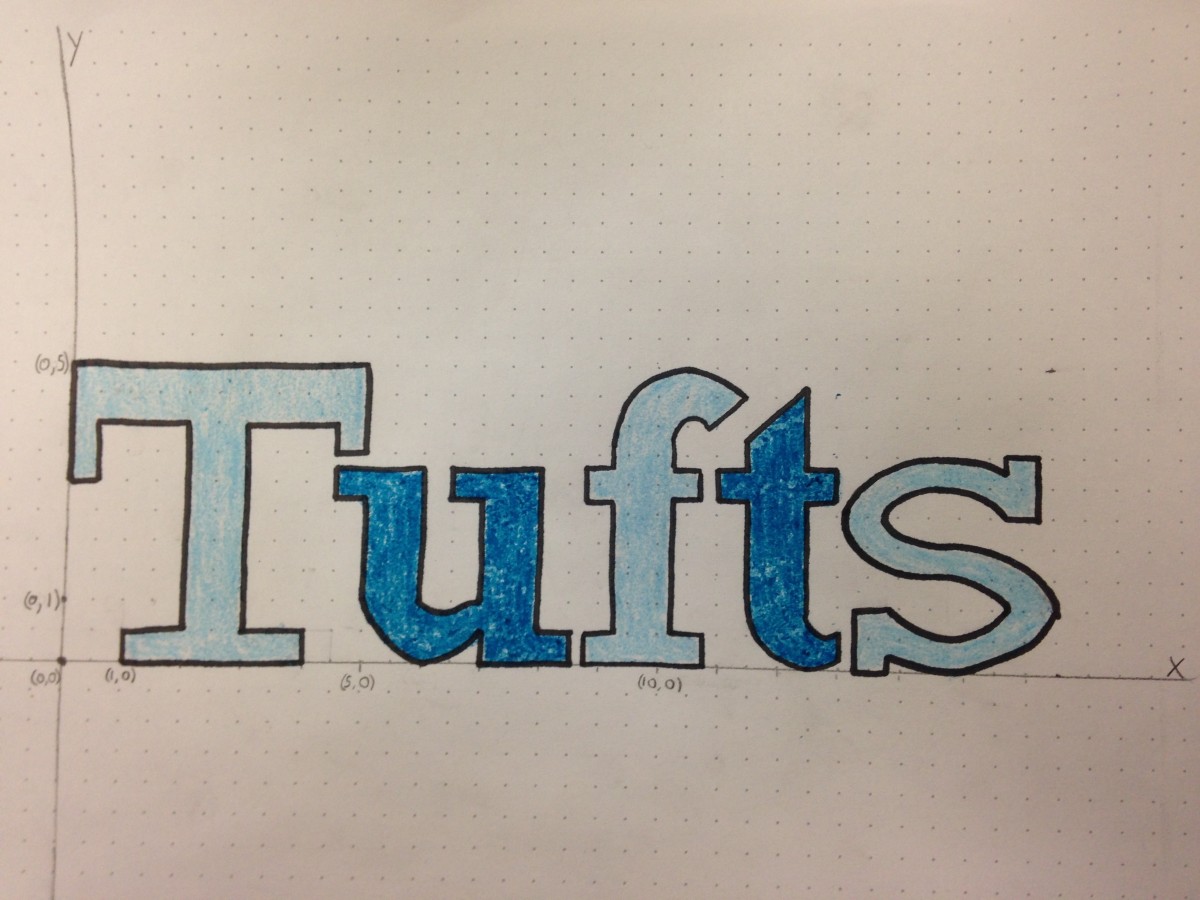
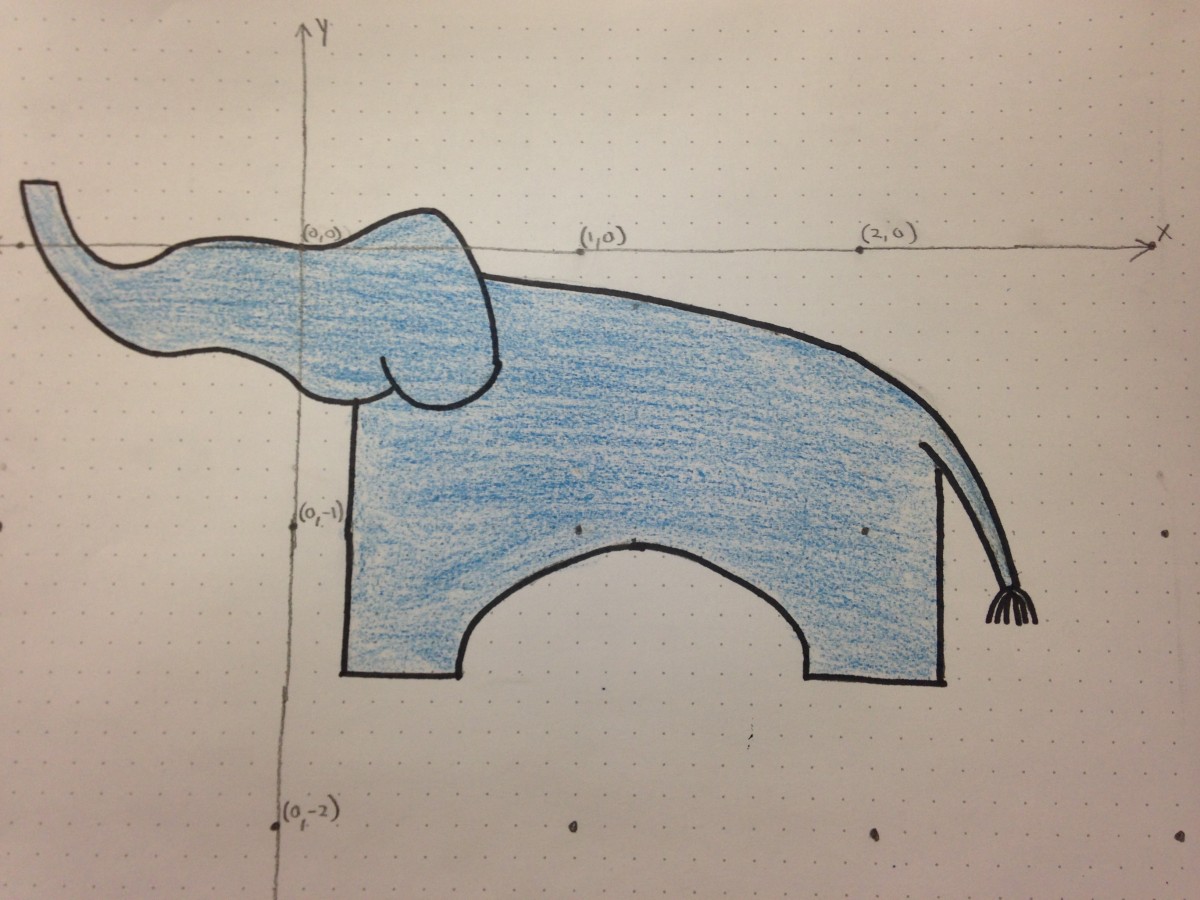
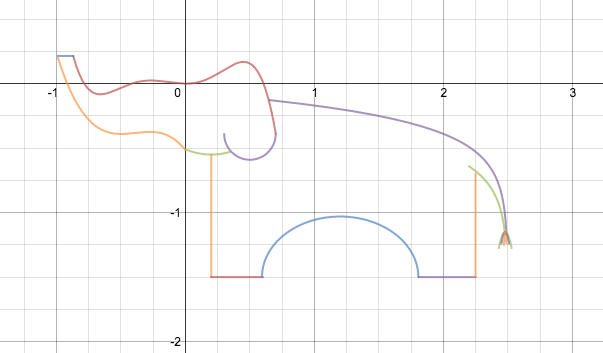
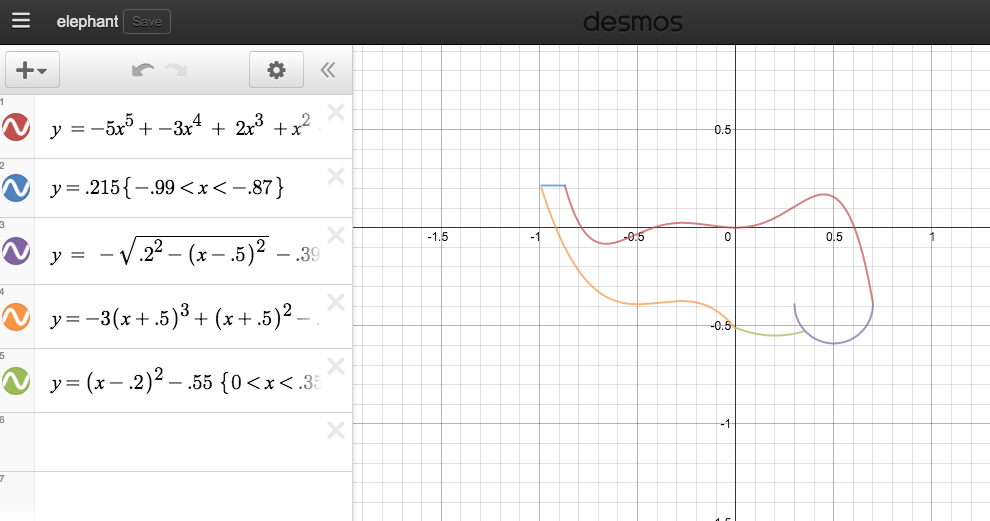
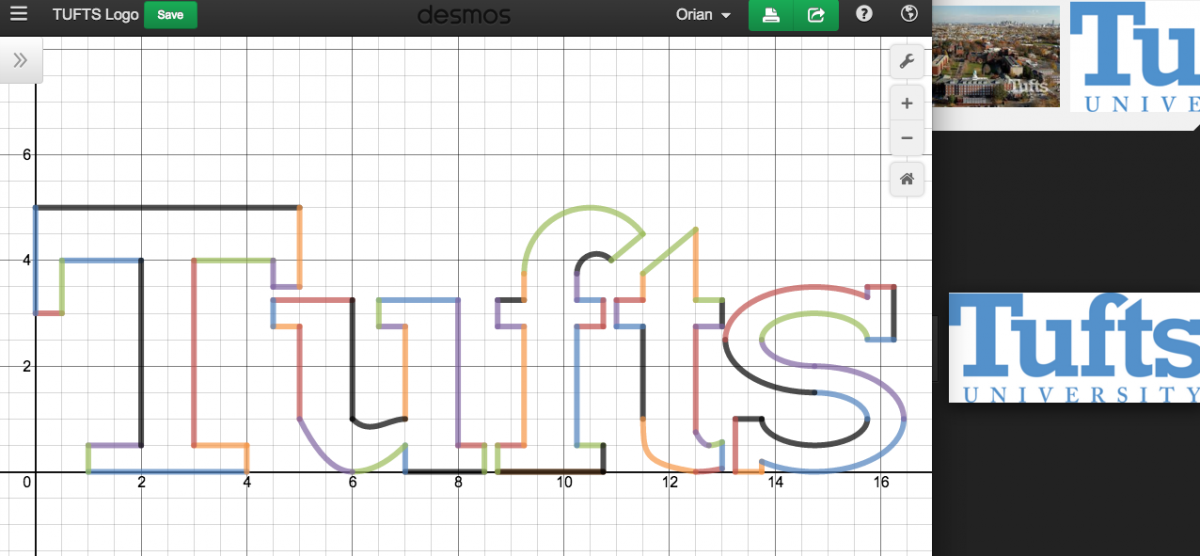
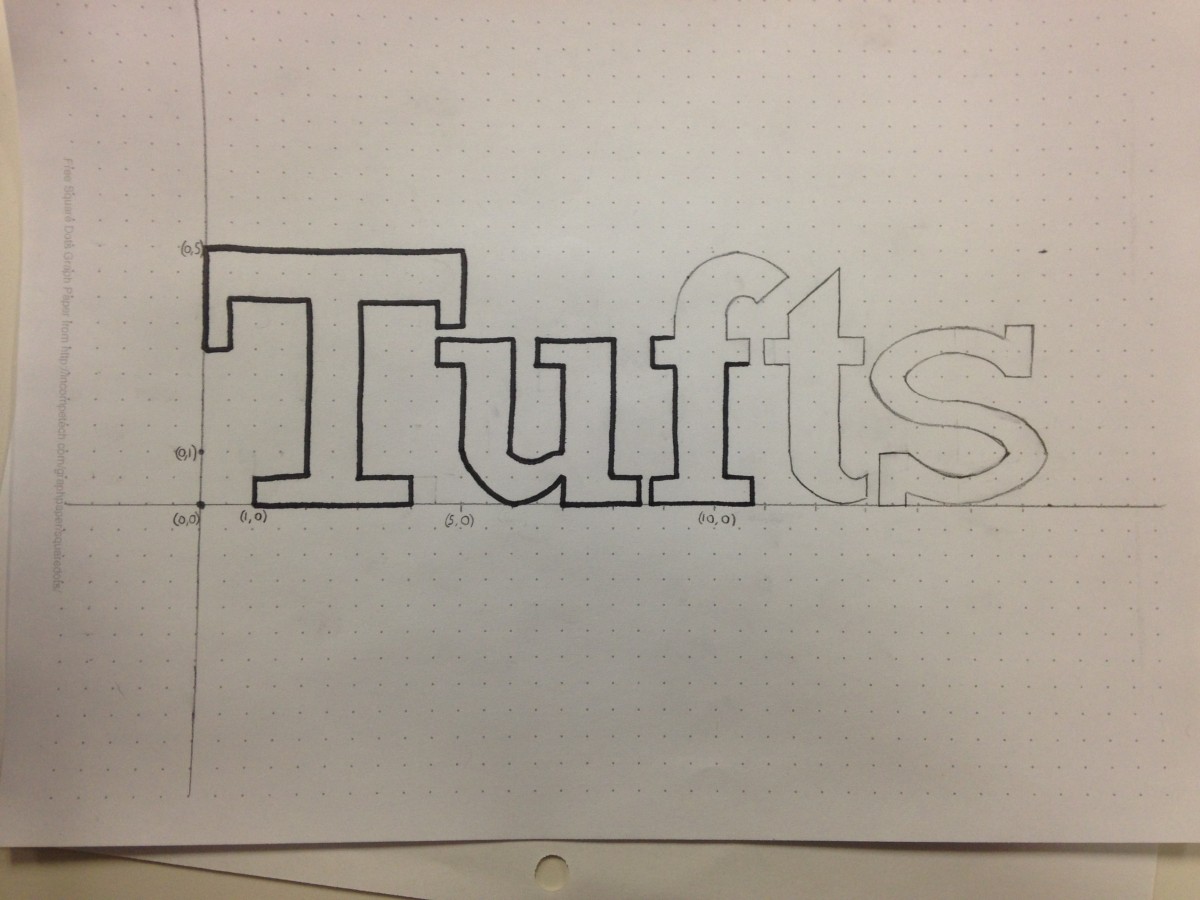
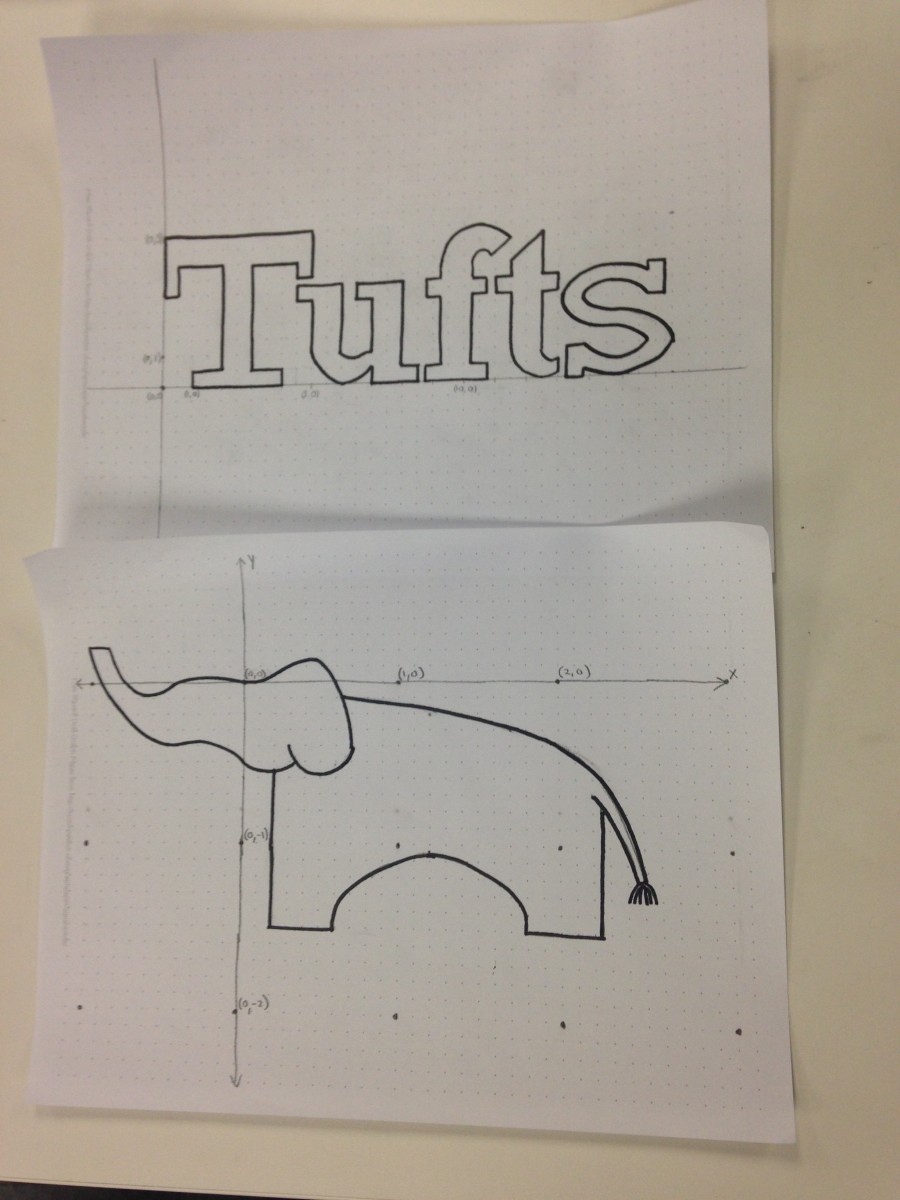
We drew out an elephant using 15 different functions and the Tufts logo using 87 functions. We utilized the online graphing tool Desmos to plot out our functions before hand drawing everything.
To view our creations on Desmos, click on either of two graphs below.
Big Idea
During this project students will:
- Interact with various types of functions
- Learn how to translate and scale functions
- Enjoy creating visual art with math
- Practice graphing by hand
- Set up proper axes and scales
Ask
We wanted the students to have to play around with various types of functions and see how functions change depending on how you change coefficients within an equation. We decided we would have them draw out a picture using functions and this would challenge the students to choose what functions would best draw the picture. The students would also interactively learn how to scale and translate functions as they needed to move and resize plots. Students would also use limits to plot specific sections of their functions.
Key questions:
- What do I want to draw?
- What functions will I need to use?
- How can I move, change, or resize functions to fit my drawing?
Brainstorm
We decided to draw out an elephant and the Tufts logo. Both pictures are very difficult and require a lot of functions, but we wanted to create pictures that would display the full effect of the project. We decided to use the online graphing tool Desmos to play with our functions until we could decide on the final equations. Desmos is free and very easy to use, but a graphing calculator could also be used.
Plan
We first found pictures of the Tufts logo and elephant to model our drawings after. We then began using Desmos to graph out our pictures. To create the kinds of curves we needed in our images we planned on incorporating certain types of functions. For example, the head of the elephant was made using a quintic function because we needed a function that would provide a good number of inflection points.


Create
Using Desmos we were able to play around with limits, scaling, and coefficients to change our functions as we needed. Once we were satisfied with our final picture we hand graphed the functions on graphing paper. We created our own axes and scaling and then graphed the pictures with pencil and marker.
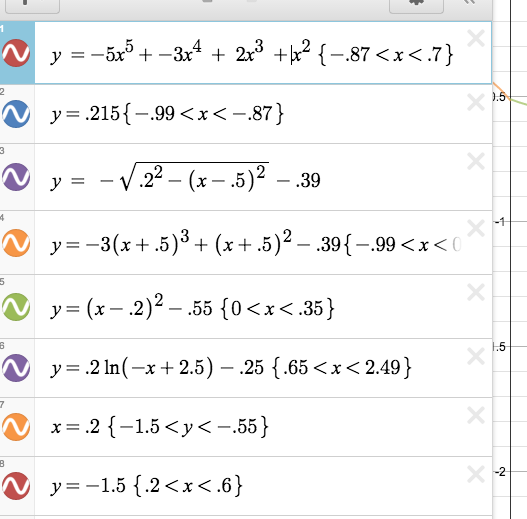
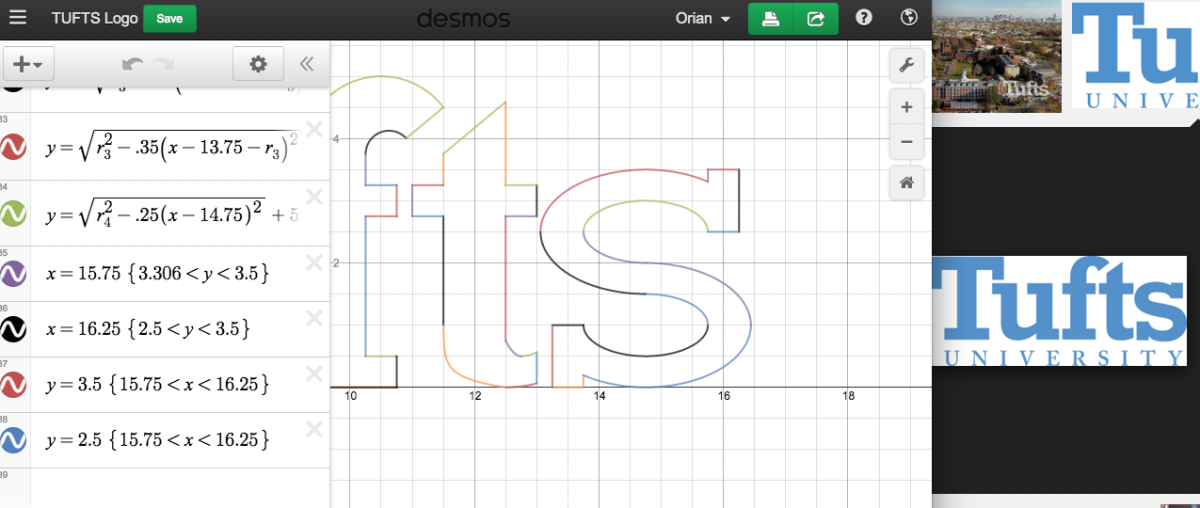
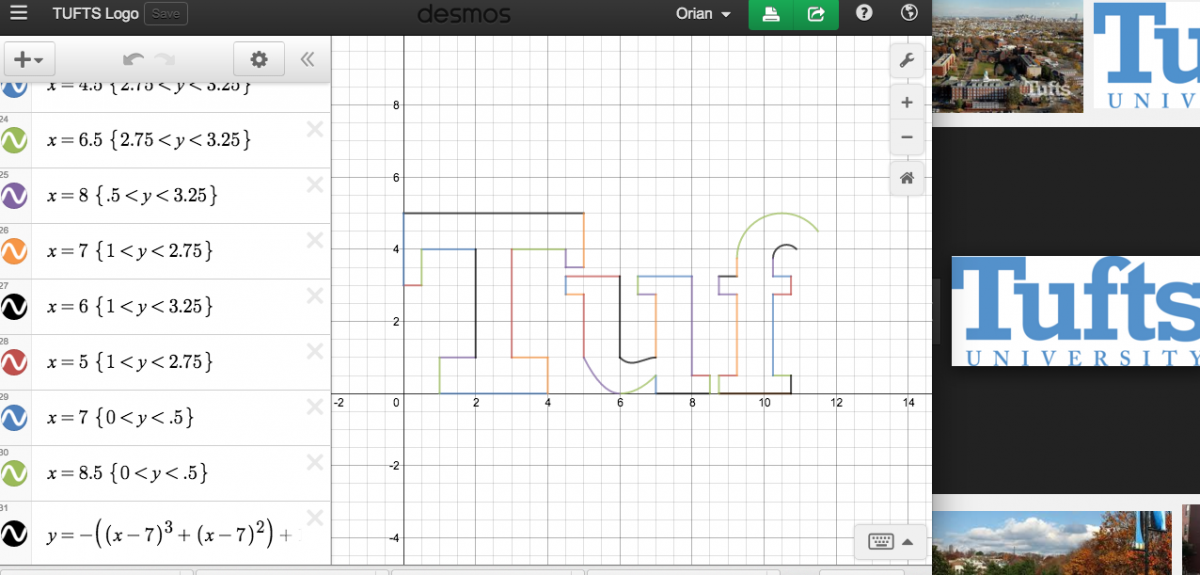
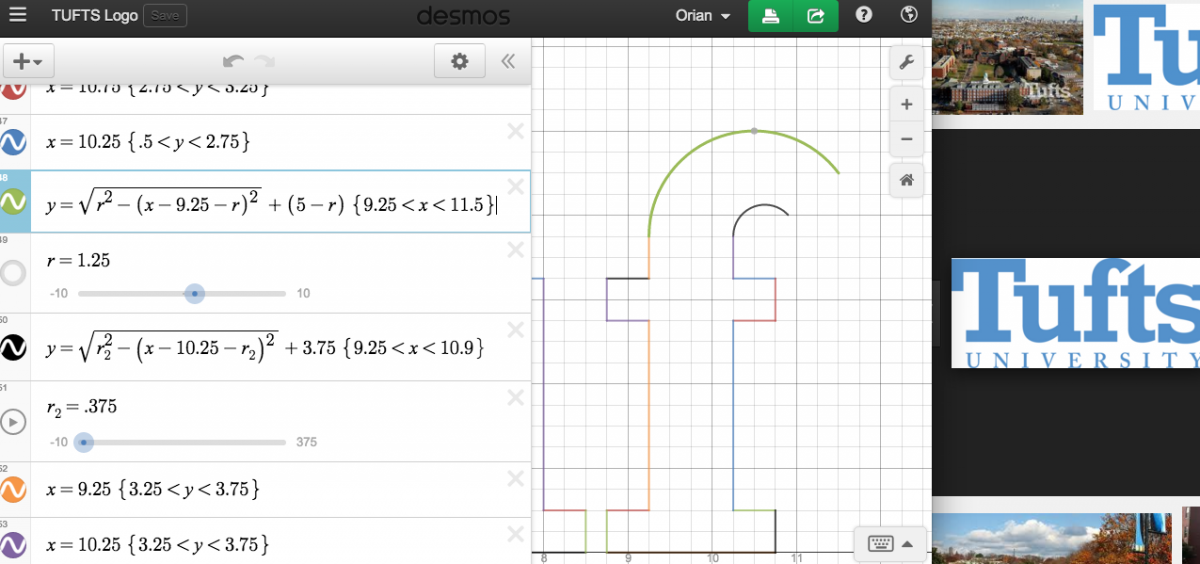
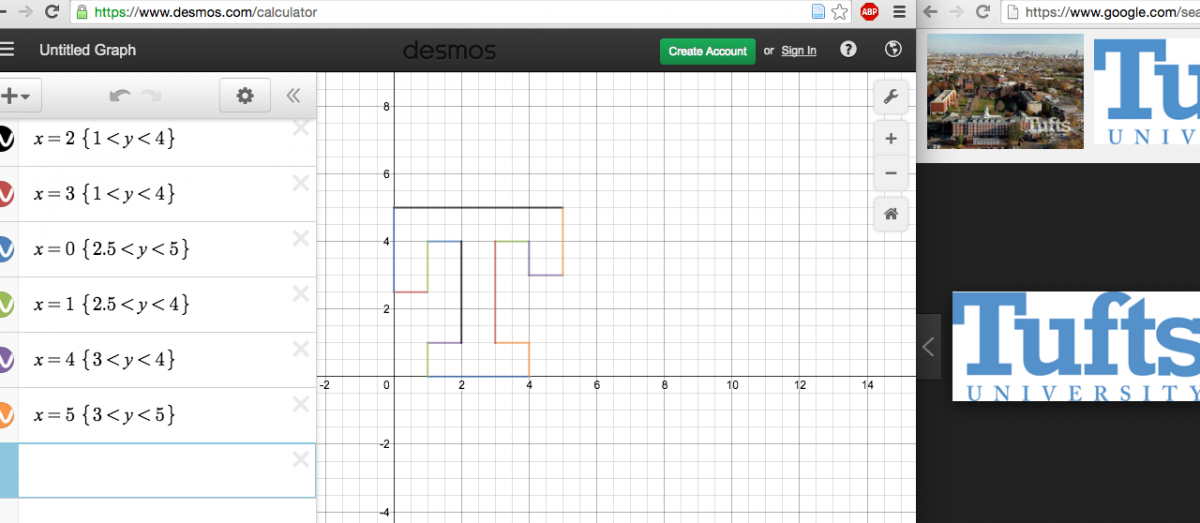
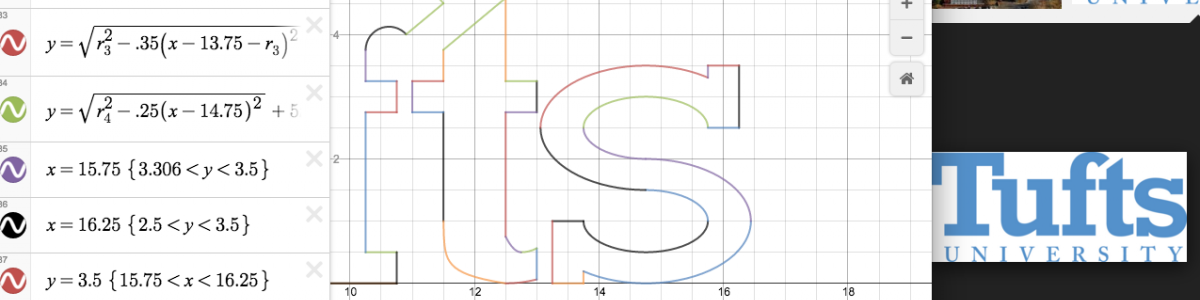
Functions Used
We compiled all of the functions used for the drawings and included the limits used for graphing. As you can see we used power functions, logarithmic functions, linear functions, parabolic functions, elliptic functions, and others.
Improve
We used Desmos and this project may be harder without the use of that tool, though a graphing calculator could conceivably be used. We also suggest choosing simpler drawings to depict as ours were very complicated and required a large number of functions.